Dairy Herd Management: Why Comparing Cows to Your Herd Average Matters
Introduction
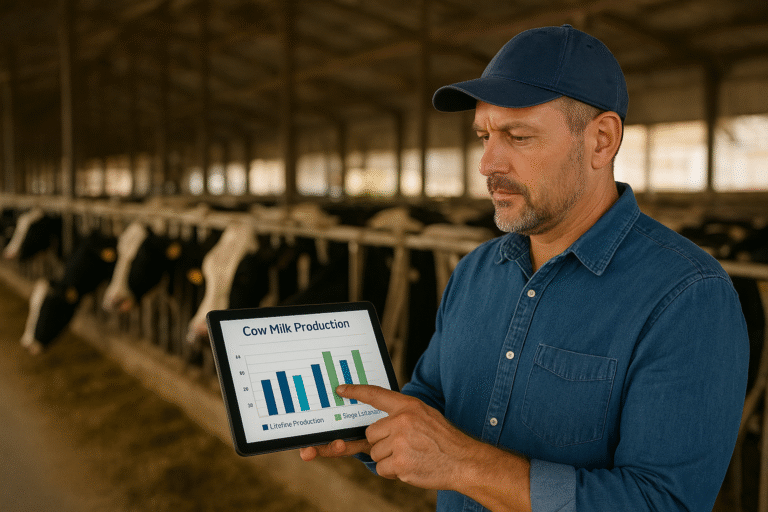
You know your top cows by name. The ones that consistently fill the tank, rarely get sick, and breed back quickly. But what about the rest of your herd?
Most dairy farmers track individual cow production, but few truly understand how each animal measures up against their herd’s actual performance over time. Here’s what surprised us when we started analyzing lifetime trajectories: the cows you think are average might be quietly costing you thousands, while some you’d consider culling could be more valuable than you realize.
The difference between good herd management and great herd management comes down to one thing: knowing which cows are truly pulling their weight across their entire productive life, not just during their best lactation. Research shows that lifetime production explains far more about a cow’s true value than any single lactation snapshot (Perneel et al., 2024). When you compare each cow’s lifetime trajectory to your herd average, patterns emerge that change everything about breeding and culling decisions.
This isn’t about gut feelings anymore. It’s about seeing your herd through data that shows you exactly where profit opportunities hide.
Why Snapshot Data Misleads You
Your monthly test day reports show current production. They’re valuable, but they’re incomplete.
A cow producing 80 pounds today might look average. But if her trajectory shows she’s been declining steadily while your herd average rises, she’s actually underperforming. Meanwhile, another cow at 75 pounds might be on an upward trend that puts her above average within months.
The problem with snapshot thinking:
- You see today’s numbers, not tomorrow’s potential
- Short-term illness can make good cows look bad
- Peak lactation performance masks long-term decline
- You miss cows who consistently outperform despite never topping the production list
Think about it this way. If you only checked your bank balance once a month, you’d miss spending patterns that drain your account. The same applies to your herd. You need to see the pattern, not just the point in time.
Farmers could get surprised when they see their first trajectory analysis. Cows they trusted for years may turn out to be chronic underperformers. Others they’d planned to cull may show rock-solid consistency above the herd average.
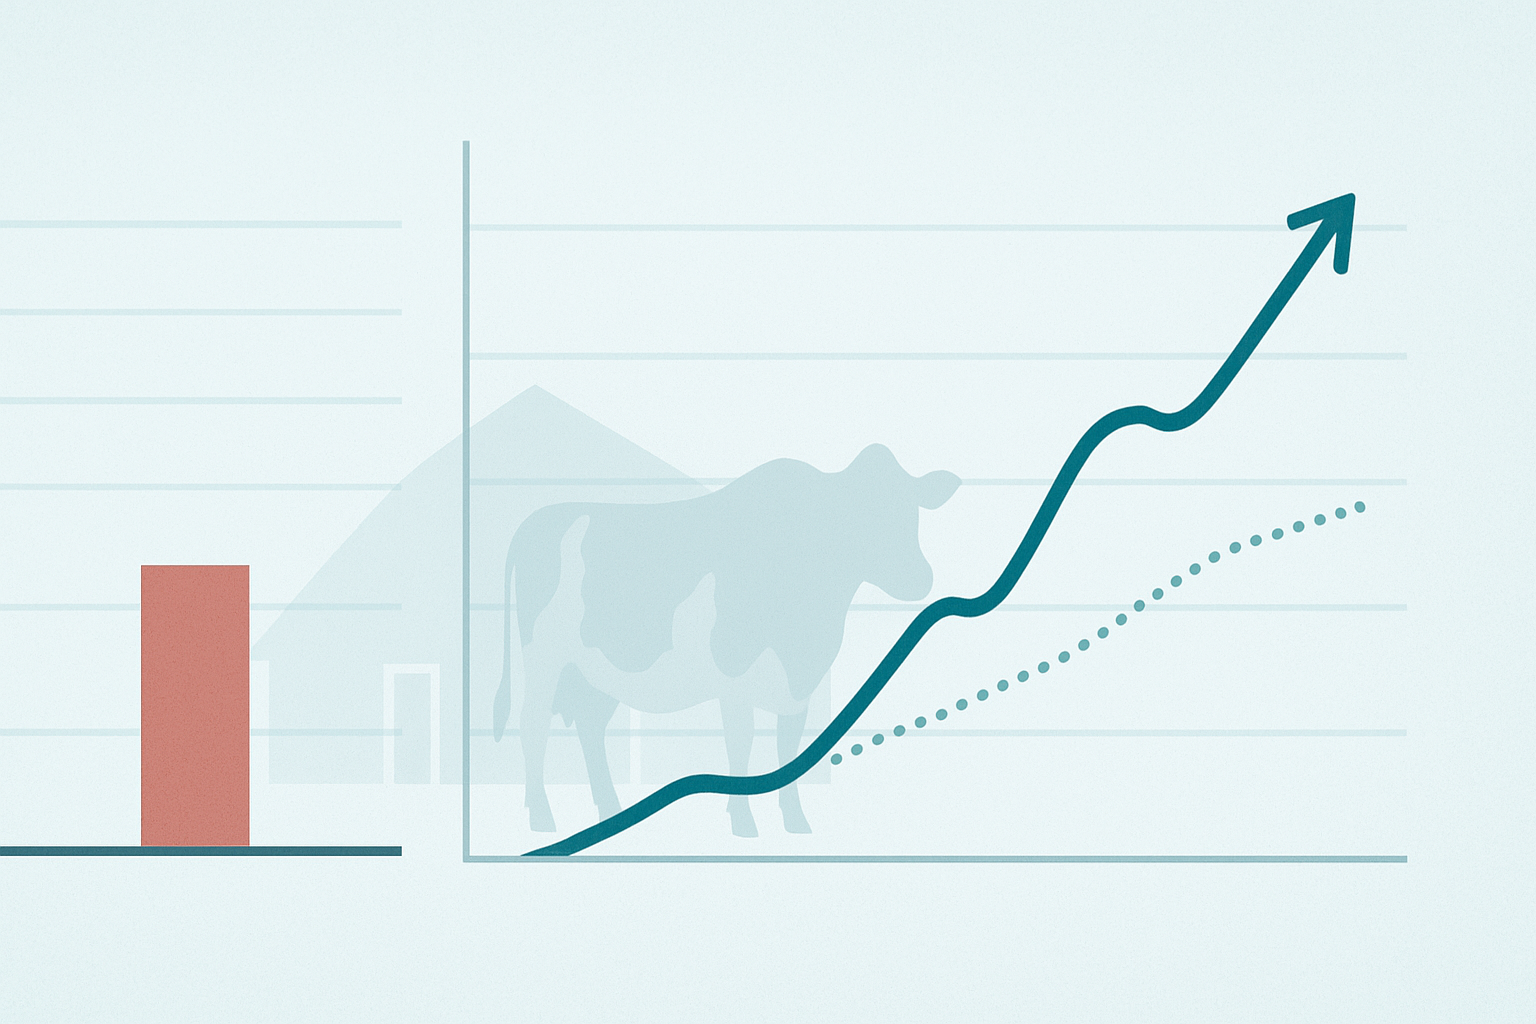
What Lifetime Trajectory Analysis Reveals
When you track each cow’s production against your herd average over her entire lifetime, you see three critical patterns.
Pattern 1: Consistent Overperformers
These cows maintain production above your herd average across multiple lactations. They don’t necessarily give the most milk, but they consistently outperform your farm’s baseline. A cow producing 75 pounds in a 70-pound average herd is more valuable than a cow producing 85 pounds in a 90-pound average herd.
Your breeding candidates emerge from this group. Their genetics, health resilience, and reproductive efficiency make them the foundation of your future herd. Research on lifetime production shows these consistent performers have significantly higher correlations with long-term profitability than cows with sporadic high production (Van Eetvelde et al., 2021).
Pattern 2: The Slow Decliners
These cows start strong but gradually fall below your herd average. By their third or fourth lactation, they’re dragging down overall production. The losses add up slowly enough that you don’t notice until you see the trajectory chart.
What if you could identify 12 cows in this pattern? Combined, they would be producing 1,200 fewer pounds per day than they should based on herd average. That’s over $200 lost daily, $6,000+ monthly, just from cows that looked “fine” in snapshot data.
Pattern 3: The Volatile Performers
These cows swing above and below your herd average unpredictably. High production one month, dropping the next, recovering later. Their inconsistency makes them risky breeding candidates and questionable long-term investments.
Understanding these patterns changes how you manage your herd. You stop making decisions based on last month’s test day and start planning based on lifetime value.
How Herd Averages Create Better Benchmarks Than Industry Standards
Industry benchmarks have a place. But your herd average tells you more about individual cow value than any generic standard.
Here’s why. A cow producing 22,000 pounds per lactation sounds impressive. She exceeds national averages. But if your herd averages 24,000 pounds, she’s actually underperforming for your operation. Your facilities, nutrition, genetics, and management create a specific environment. Cows should be evaluated against that reality, not against farms with different resources and constraints.
Your herd average accounts for:
- Your feed quality and nutrition program
- Your facility design and cow comfort
- Your genetics and breeding decisions
- Your disease management effectiveness
- Your climate and seasonal challenges
When you benchmark against your own herd, you identify which cows adapt best to YOUR farm. Those are the animals you want reproducing.
Farmers may keep cows that look great on paper but consistently underperformed their herd average. A farmer may keep a cow with impressive genetic indexes for five lactations. She would never get sick, breed easily, and produce respectable numbers. But trajectory analysis may show she never once met his herd average across any lactation. Over five years, that single cow could cost the farm approximately $8,000 in lost production compared to what an average performer would have generated.
The reverse happens too. Farmers may cull cows that seem mediocre but consistently perform above their herd average. Those animals should be your breeders.
The Financial Impact of Trajectory-Based Decisions
Numbers make this real. Let’s walk through what trajectory analysis means for your bottom line.
Scenario 1: The Underperformer You Kept Too Long
Cow produces 75 pounds daily. Your herd averages 80 pounds. That’s 5 pounds short, every single day. Over a 305-day lactation, she’s 1,525 pounds behind where she should be. At $0.40 per pound, that’s $610 lost per lactation. Keep her for three lactations below average, and she’s cost you $1,830 in unrealized production alone.
Multiply that by the number of chronic underperformers in your herd. If you have 10 cows following this pattern, you’re leaving $18,000 on the table across their productive lives.
Scenario 2: The Consistent Performer You Overlooked
Another cow produces 78 pounds daily. Your herd averages 80 pounds. She looks like a candidate for culling or at best, beef breeding. But trajectory analysis reveals she’s been trending upward every lactation while your herd average has been flat or declining. She’s actually one of your most reliable producers relative to herd performance trends.
Breeding this cow gets you calves with her resilience and consistency. Culling her means losing genetics that work in your operation.
The Compounding Effect
Good trajectory-based decisions compound. Keep the right cows, breed them strategically, and cull the chronic underperformers. Within three years, your entire herd composition shifts. Average production per cow increases while herd size can actually decrease. More milk from fewer cows means lower costs and higher efficiency.
Research demonstrates that extending productive lifespan through improved cow selection significantly reduces greenhouse gas emissions per unit of milk while improving farm profitability (Han, R. et al., 2024). A farm may maintain the same production with 8% fewer cows simply by culling chronic underperformers and breeding their consistent top performers. The savings on feed, labor, facility wear, and veterinary costs were significant.
How to Start Using Trajectory Analysis on Your Farm
You don’t need expensive software on day one. You can start with your existing data.
Step 1: Gather Your Production Records
Pull together your test day reports for the last 2-3 years minimum. You need enough data to see patterns across lactations. Most herd management systems (like DC305) already store this information. You’re just looking at it differently.
Step 2: Calculate Your Rolling Herd Average
Your herd management software calculates this automatically. It’s the average production per cow across all lactations currently in progress. This becomes your baseline for comparison.
Step 3: Identify Your Outliers
Look for cows that consistently produce above your herd average and those that consistently fall below. Patterns across multiple test days and lactations matter more than one month’s data.
Focus on cows in third lactation or higher first. They have enough production history to reveal reliable patterns.
Step 4: Look for Trajectory Patterns
Is the cow maintaining, improving, or declining relative to your herd average over time? A cow who started at 110% of herd average but now produces 95% is declining. A cow who started at 90% but now hits 105% is improving.
The pattern matters more than any single data point.
Step 5: Adjust Your Management Decisions
Use trajectory insights to inform your breeding and culling plans. Breed your consistent overperformers with sexed semen. Put your chronic underperformers on beef semen or cull them sooner. Watch your volatile performers closely, they may need different nutrition or health protocols.
This isn’t about making massive changes overnight. Start with your most obvious overperformers and underperformers. As you get comfortable with trajectory thinking, you’ll refine your approach.
Common Pitfalls When Using Trajectory Data
Even when farmers have trajectory data, interpretation challenges can arise. Here’s what to watch for.
Pitfall 1: Overreacting to Short-Term Dips
A cow drops below herd average for two months after a health event. This temporary setback might trigger premature culling decisions. But if her overall trajectory shows consistent overperformance, that dip is likely temporary. Give her time to recover and see if she returns to her pattern.
Health challenges happen. Trajectory analysis helps you distinguish between temporary setbacks and permanent decline.
Pitfall 2: Focusing Only on Peak Performance
A cow had an amazing second lactation, producing 30,000 pounds. But her first lactation was mediocre, and her third lactation dropped significantly below your herd average. That peak performance doesn’t define her value. Her overall trajectory does.
Many farmers develop strong attachments to cows who had one exceptional lactation. The data provides clarity. If the overall pattern shows decline or inconsistency, that peak was an outlier, not a predictor of future performance.
Pitfall 3: Overlooking Herd Average Changes
Your herd average isn’t static. If you improve nutrition, upgrade facilities, or change your breeding program, your herd average should rise over time. A cow who once performed above average might fall below the new, improved average. That doesn’t mean she got worse. It means your herd got better, and she didn’t keep pace.
This is actually good news. It means your management improvements are working. But it also means you need to continually reassess which cows meet your evolving standards.
Pitfall 4: Using Trajectory Data in Isolation
Trajectory analysis is powerful, but it’s not the only factor in culling and breeding decisions. Health history, reproductive efficiency, genetics, and even temperament matter. A cow who consistently produces above herd average but has chronic mastitis or won’t breed back isn’t necessarily a keeper.
Use trajectory data as one important input in a broader decision-making framework, not as the sole determining factor. Studies examining cow longevity consistently show that culling decisions involve complex interactions between health status, reproductive performance, and economic factors (Owusu-Sekyere et al., 2023).
Integrating Trajectory Analysis With Your Current Management System
You already track production. Trajectory analysis just changes how you interpret that data.
Most modern herd management software can generate reports showing individual cow performance relative to herd averages. If you’re using DC305, DairyComp, or similar systems, this data already exists. You’re just not looking at it through a trajectory lens yet.
Make it part of your routine:
During monthly test day reviews, include trajectory checks for your cows in later lactations. Which animals are trending down? Which ones are exceeding expectations? This takes 15-20 minutes once you know what you’re looking for.
When making quarterly breeding decisions, reference trajectory data. Are you breeding your consistent overperformers? Are you putting underperformers on beef semen? Trajectory analysis guides these choices with evidence, not guesswork.
Annual culling reviews become much clearer when you have trajectory data. Instead of agonizing over which cows to cull, the chronic underperformers reveal themselves through their production patterns.
Share this data with your veterinarian and nutritionist too. When they understand which cows consistently perform above or below herd average, they can help you identify why. Is it health management? Nutrition? Genetics? Facility issues? Collaborative problem-solving gets easier when everyone works from the same performance picture.
Conclusion: From Our Family to Yours
Dairy farming runs in families because knowledge passes down through generations. Your father and grandfather taught you to recognize a good cow by eye. That skill matters. But today’s dairy operations are too complex and margins too tight to rely on instinct alone.
Trajectory analysis doesn’t replace your expertise. It enhances it. You still know your cows better than any spreadsheet. But now you can see patterns that aren’t visible to the eye, patterns that reveal which animals deserve to be the mothers and grandmothers of your future herd.
When you compare each cow to your herd average across her lifetime, you make better breeding decisions. You cull smarter. You invest your resources in animals that actually generate returns. Over time, these decisions compound into a significantly more profitable and efficient operation.
The farms that thrive in the next decade won’t be the biggest. They’ll be the ones making the smartest decisions with their herd composition. Trajectory analysis gives you the clarity to make those decisions with confidence.
Ready to see your herd’s trajectories?
We’ve built a demonstration showing how trajectory analysis works with real farm data. You’ll see exactly what patterns to look for and how trajectory benchmarking reveals opportunities you’re missing with snapshot data alone. See our Cow Performance Rankings tool
Your herd holds hidden profit potential. Trajectory analysis shows you where to find it.
References
Owusu-Sekyere, E., Hansson, H., and Telezhenko, E. (2023). Dairy cow longevity: Impact of animal health and farmers’ investment decisions. Journal of Dairy Science, 106(5), 3207-3220. https://www.journalofdairyscience.org/article/S0022-0302(23)00162-5/fulltext
Perneel, M., De Smet, S., and Verwaeren, J. (2024). Data-driven prediction of dairy cattle lifetime production and its use as a guideline to select surplus youngstock. Journal of Dairy Science, 107(11), 9390-9403. https://www.journalofdairyscience.org/article/S0022-0302(24)00069-9/fulltext
Van Eetvelde, M., Verdru, K., de Jong, G., van Pelt, M.L., Meesters, M., and Opsomer, G. (2021). Researching 100 t cows: An innovative approach to identify intrinsic cows factors associated with a high lifetime milk production. Preventive Veterinary Medicine, 193, 105392. https://www.sciencedirect.com/science/article/pii/S0167587721001367
Han, R., Kok, A., Mourits, M., and Hogeveen, H. (2024). Effects of extending dairy cow longevity by adjusted reproduction management decisions on partial net return and greenhouse gas emissions: A dynamic stochastic herd simulation study. Journal of Dairy Science, 107(9), 6902-6912. https://www.sciencedirect.com/science/article/pii/S0022030224007689
Related Resources:
- Disease Burden Analysis: See the Hidden Cost of Disease
- All DairyCommand Features
- About Our Scientific Approach
About DairyCommand
From our family to yours: we’re dairy people who understand that every cow represents an investment and every decision matters. DairyCommand combines veterinary science, data analytics, and practical farm experience to help you build a more profitable, sustainable operation. Learn more about our herd optimization tools at signal2action.com