You just invested $200,000 in a barn renovation. New ventilation systems, softer bedding, automated cleaning. The whole operation looks modern and efficient.
Six months later, mastitis rates dropped 15%. That’s good news. But milk per cow barely improved. Some animals still struggle. Others thrive in the exact same environment.
Here’s what’s actually happening: better facilities reduce disease frequency, but they don’t build disease resilience into your herd. The same genetically susceptible cows are still there, just getting sick less often. They’re still costing you money in lost production every single day.
Disease-resilient cows aren’t just healthy cows. They’re cows that maintain production despite health challenges. These are the animals you want to breed, regardless of your barn setup. From our family to yours, our tools help reveal this critical difference in your own herd data. It changes everything.
What Disease Resilience Actually Means
Beyond Health Records to Production Resilience
Let’s clear up a common misconception right away. Disease resilience does not mean never getting sick.
All cows face health challenges. Mastitis, lameness, metabolic disorders. These happen even in the best-managed herds with the most advanced facilities. What separates resilient cows from susceptible ones is how they respond to these challenges.
Resilient cows recover faster and maintain milk production during and after illness. They bounce back. Susceptible cows don’t.
Here’s an example what this means. Two cows, both experiencing clinical mastitis in early lactation:
Cow A: Drops from 39 liters per day to 25 liters. Never fully recovers. Finishes the lactation averaging 31 liters per day. The mastitis case “resolved” according to treatment records, but this cow lost approximately 1,200 liters in lifetime production value.
Cow B: Drops from 40 liters per day to 33 liters. Rebounds to 37 liters within three weeks. Finishes the lactation averaging 38 liters per day. Treatment records show the same mastitis diagnosis, but this cow maintained her value.
Cow B demonstrates production resilience. That’s what you want to breed into your herd.
How We Identify Resilience
DairyCommand’s Cow Performance Ranking System uses what we call the Composite Health Index. This combines four critical factors:
- Lifetime disease history: Not just whether a cow got sick, but when in her lactation cycle and how often
- Recovery patterns: Production trajectories after illness, comparing actual performance to expected curves
- Genetic predisposition scores: Known genetic factors affecting disease susceptibility and immune response
- Reproductive efficiency: Ability to conceive and maintain pregnancy despite health events
The lifetime perspective matters more than most farmers realize. Snapshot evaluations miss resilience patterns completely. A cow with two health events over four lactations who maintains production is more valuable than a “perfectly healthy” cow with declining yields and no diagnosed problems.
Traditional genetic evaluations penalize any health event. Our system rewards production maintenance. That’s the difference between selecting for disease avoidance versus selecting for disease resilience.
The Complete Workflow: From Disease Costs to Cow Selection
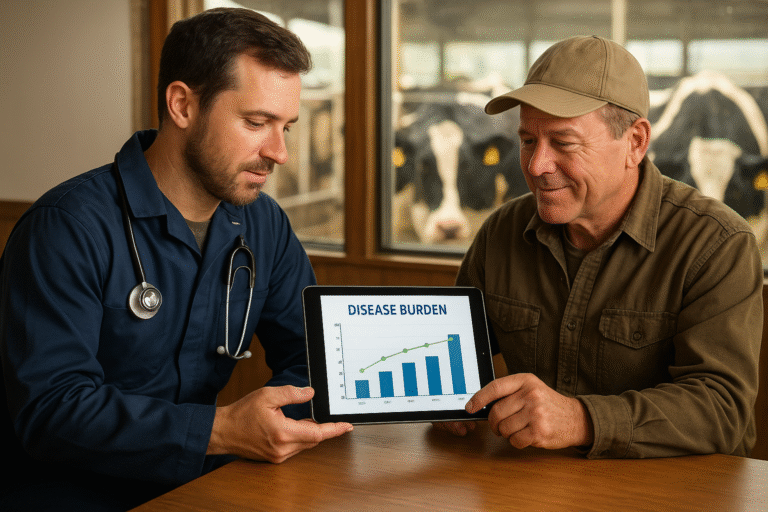
Step 1: Quantify Where Disease Costs You
You can’t fix what you can’t measure. The first step is running a comprehensive disease burden analysis to identify where your herd is losing money.
This analysis reveals three critical insights:
- Which diseases cause the largest milk losses in dollar terms
- Which health events show worsening trends over time
- Where your management protocols are working and where they’re failing
Here’s a hypothetical example of what a 180-cow farm might discover when running their first analysis. Mastitis could be costing them $22,000 annually in hidden milk losses. Not treatment costs or discarded milk. Just the extended production losses that never show up in their accounting system.
The real breakthrough would come from the next insight: 60% of those losses likely come from just 15 cows. Recurring cases, chronic issues, animals that never fully recover between events.
These 15 animals would be dragging down the entire herd average despite having “acceptable” somatic cell counts according to bulk tank measurements.
Step 2: Identify Which Cows Are Disease-Resilient
Once you know where disease costs you money, the next question is simple: which specific cows are the problem, and which ones are performing well despite challenges?
Monthly cow rankings incorporate disease history into the Composite Health Index. These rankings reveal three distinct groups:
Top performers: High production despite occasional health events. These are your resilient animals. They might experience mastitis or lameness, but they recover quickly and maintain their production curves. These cows stay in your breeding program.
Average performers: Moderate production with moderate health challenges. They’re not exceptional, but they’re not costing you money either. These animals can stay in the herd but shouldn’t be your breeding priorities.
Bottom performers: Declining production, multiple health events, poor recovery patterns. Every day these cows stay in your herd, they’re reducing your average and consuming resources that could support better animals. These are your culling candidates.
The Integrated Insight
Disease burden analysis shows which diseases cost the most. Cow rankings show which specific cows are most affected and which demonstrate resilience. Together, these tools create a complete picture.
You’re not guessing which animals to breed based on a single health event or last month’s milk weights. You’re making informed decisions based on lifetime patterns, genetic predisposition, and proven production resilience.
Step 3: Make Data-Driven Breeding Decisions
Once you have both pieces of information, the breeding strategy becomes clear:
Breed exclusively from top performers. These are your disease-resilient, productive animals. Their genetics improve your herd’s baseline resilience with every generation.
Cull bottom performers strategically. These are the disease-prone, declining production animals. They’re not just underperforming today. They’re passing susceptibility to the next generation if you breed them.
Here’s a critical distinction in breeding strategy: you’re not breeding for “perfect health.” That’s impossible. Every cow will face health challenges at some point. You’re breeding for production resilience, the ability to maintain value despite those challenges.
The Timeline
Building a disease-resilient herd isn’t a quick fix. It’s a systematic process with clear milestones:
Every 6 months: Run disease burden analysis to monitor herd-level trends and protocol effectiveness.
Every month: Update cow rankings to guide ongoing breeding and culling decisions.
Over 2 to 3 years: Track improvement as your herd’s genetic composition shifts toward resilience.
The compounding effects become visible around 18 months when your first generation of purpose-bred replacements enter the milking herd.
Real-World Application: The Disease-Resilient Selection Strategy
Hypothetical Scenario: A 150-Cow Herd with High Mastitis Burden
Let’s walk through a realistic scenario that illustrates how this integrated approach works in practice. This is a hypothetical example designed to demonstrate the decision-making process.
Initial Analysis (Month 0)
Consider a farm running their first complete analysis combining disease burden assessment with cow performance rankings. Here’s what they might discover:
Disease burden analysis might reveal 26,000 liters of annual milk loss across all disease conditions. Of this total, mastitis accounts for approximately 9,400 liters (36% of total losses). These are extended production losses that occur during and after disease events, not including discarded milk from treatment.
The detailed analysis could show that just 25 cows (17% of the herd) account for 70% of those mastitis-related losses. These wouldn’t be random cases. These would be chronic, recurring problems. Same animals, same issues, month after month.
Cow performance rankings would break the entire 150-cow herd into three groups:
Top 25% (approximately 38 cows): These might demonstrate strong disease resilience. They would have occasional mastitis cases, but maintain at least 85% of their expected production throughout lactation. These animals would recover quickly and stay productive.
Middle 50% (approximately 75 cows): These would show average performance. Moderate health challenges, moderate production. Not exceptional, but not problematic either.
Bottom 25% (approximately 37 cows): These would fall into the low-performing tier. Higher disease frequency, declining production trajectories, poor recovery patterns. Within this group, about 25 cows would show chronic mastitis patterns actively costing the farm milk production.
Action Plan Implementation
Based on these findings, a farm might implement a clear four-part strategy:
Immediate culling: The bottom 15 cows (the worst chronic cases) would be removed from the herd. These would be animals with persistent mastitis, already below the profitability threshold based on their lifetime trajectories.
Revised breeding strategy: Only the top 38-40 cows would be bred. This would mean breeding exclusively from animals demonstrating both resilience and production. No exceptions, even for cows with good current milk weights but poor health histories.
Focused management resources: Instead of trying to fix every problem animal, management efforts would concentrate on supporting the resilient cows. Better cows respond better to improved protocols.
Continuous monitoring: Monthly ranking updates would track which animals maintained their status and which ones changed categories. The disease burden analysis would be rerun at 6 and 12 months to quantify improvement.
Projected Results After 12 Months
The transformation could be measurable across multiple metrics:
Milk losses from mastitis could decrease substantially. From the initial 9,400 liters annually down to approximately 6,000 liters. That’s a reduction of 3,400 liters recovered (36% improvement). At $0.55 per liter, this represents approximately $1,870 in recovered revenue annually.
Herd size would decrease slightly. From 150 cows down to 140 (with the 15 chronic cases culled and 5 additional animals removed through normal turnover). Total herd production would stay similar because average production per cow increases.
Genetic improvement would become visible in the rankings. The number of top-tier resilient cows could increase from 38 to approximately 50-55 cows. This would happen through culling the worst performers (which raises the herd average) and breeding exclusively from resilient animals (so replacements enter with better genetics).
Management would become simpler. Fewer problem animals would mean less time treating chronic cases and more time focusing on protocols that work for responsive animals.
Understanding the Production Difference
The graph above shows what happens during a standard 305-day lactation when two cows experience mastitis at Day 60.
The disease-resilient cow (blue line) experiences a production drop from about 35 liters per day down to 25 liters at the time of infection. Within 20 days, she recovers to approximately 32 liters per day and maintains a trajectory close to her expected curve for the remainder of lactation.
The disease-susceptible cow (red line) drops to about 20 liters per day at infection. Her recovery is slower and incomplete. She plateaus at around 28 liters per day and continues producing 3 to 4 liters less per day than the resilient cow for the remainder of lactation (245 days).
The cumulative difference: That 3 to 4 liter per day gap, sustained over 245 days, equals approximately 1,200 liters of lost milk production per lactation. At $0.55 per liter, this single mastitis case costs an additional $660 in the susceptible cow compared to the resilient cow, beyond the immediate treatment costs.
This is why resilience matters more than simply avoiding disease. Both cows got mastitis. Only one maintained her production value.
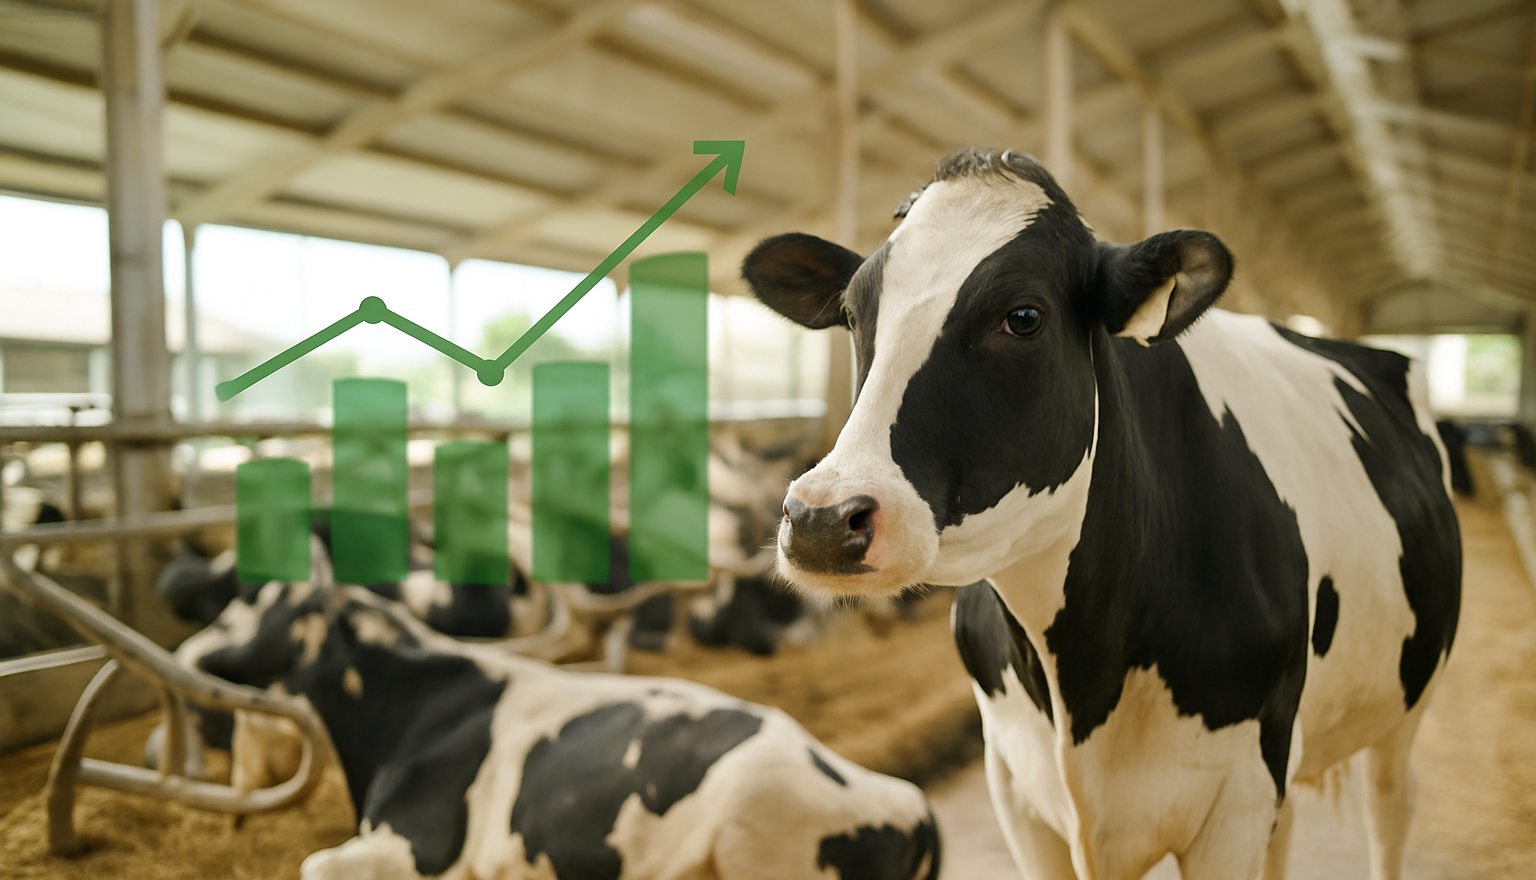
The Compound Benefit Over Time
This case illustrates something critical about building disease resilience. The benefits compound over time:
Immediate benefit: Reduced disease treatment costs and labor from removing chronic problem animals.
Short-term benefit: Improved herd average production as low performers exit and resources shift to responsive animals.
Medium-term benefit: Genetic improvement becomes measurable as purpose-bred replacements enter the milking herd.
Long-term benefit: The herd becomes progressively easier to manage as the genetic baseline shifts toward resilience. Each generation requires less intervention because the underlying genetics are stronger.
This isn’t about working harder. It’s about working with better genetics.
Why This Approach Beats Traditional Genetic Evaluations
The Limitations of Static Genetic Indexes
Most farmers rely on traditional genetic evaluations for breeding decisions. These systems have value, but they miss critical information about disease resilience.
Here’s what traditional evaluations can’t tell you:
The snapshot problem. Traditional genetic indexes typically use data from single lactations or limited timeframes. They might show a cow’s current production level, but they don’t reveal how she maintains production across multiple lactations and health challenges.
Indirect proxies instead of actual resilience. Most systems use somatic cell count as a proxy for mastitis resistance. But SCC doesn’t tell you whether a cow maintains production during and after a mastitis case. You might be selecting animals with low SCC who still lose significant production when challenged.
No production context for health events. Genetic evaluations might flag that a cow had mastitis, but they don’t quantify how that affected her lifetime value. Did she recover in three weeks or three months? Did she maintain 90% of expected production or drop to 60%? Traditional systems don’t capture this.
Update frequency is too slow. Most genetic evaluations update annually or even less frequently. By the time you get updated information, you’ve already made months of breeding decisions based on outdated data.
DairyCommand’s Lifetime Trajectory Advantage
Our system addresses every one of these limitations:
Continuous lifetime evaluation. We analyze complete lactation histories, not snapshots. A cow’s ranking reflects her entire production pattern from first lactation through current status.
Integrated health data. Disease history isn’t tracked separately from production. It’s integrated into the performance score. The system automatically accounts for timing, frequency, and recovery patterns.
Production resilience as the primary metric. We don’t just measure whether a cow gets sick. We measure whether she maintains value despite health challenges. That’s what actually matters for your bottom line.
Monthly ranking updates. Every month, rankings refresh to reflect current performance and new health events. You’re making breeding decisions based on up-to-date information, not year-old data.
Clear actionable tiers. Instead of abstract genetic indexes, you get straightforward categories: top performers to breed, average performers to maintain, bottom performers to cull. The decision framework is built into the rankings.
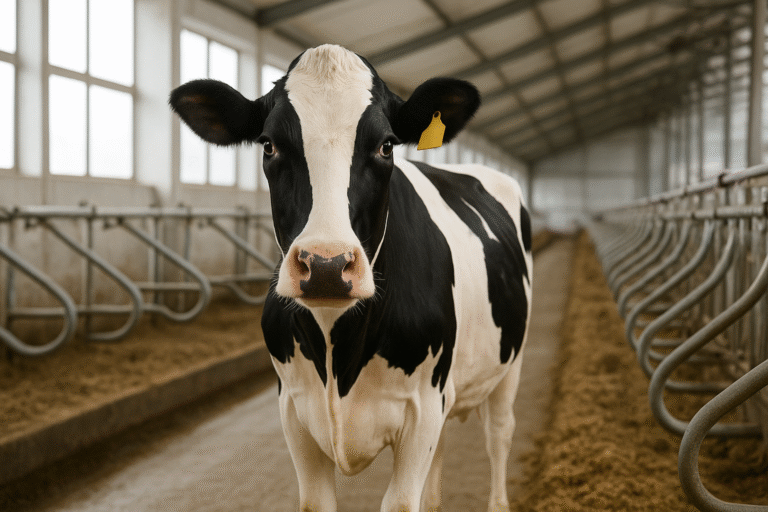
The Barn Connection
This brings us back to where we started: your dairy cow barn and facilities.
Your facility matters. Good ventilation, comfortable bedding, clean environments. These things reduce disease frequency and improve animal welfare. You should absolutely invest in facility improvements when economics allow.
But here’s the truth: you can’t manage your way around genetically susceptible cows. Even in the best barn with the most advanced protocols, disease-prone animals will underperform resilient ones in the exact same environment.
We’ve seen this pattern repeatedly. Two farms with identical facilities, identical protocols, identical feed programs. One farm has significantly better production and lower disease costs. The difference? One farm systematically bred for genetic resilience over several years. The other focused only on facility improvements.
Investment Priority Framework
Here’s how we recommend farmers think about resource allocation:
First priority: Select for genetic resilience through data-driven breeding. This creates lasting improvement that compounds every generation. The investment is minimal compared to facility upgrades, but the long-term return is substantial.
Second priority: Optimize facility and management to support resilient genetics. Once you have better animals, they respond better to improved protocols. Your investments in facilities and management generate higher returns when applied to genetically superior cows.
The result: Compound improvements. Better genetics plus better management creates synergistic effects. Each improvement amplifies the other. This is how you build a truly high-performing herd.
Starting with facility improvements alone is like building a beautiful house on a weak foundation. The structure looks good, but the underlying problems remain.
Getting Started: Your Action Plan
Three Steps to Building a Disease-Resilient Herd
Let’s make this practical. Here’s exactly how to implement this approach on your farm, with clear timelines and milestones.
Step 1: Establish Your Baseline (Months 0 to 6)
The first six months are about understanding your current situation. You can’t improve what you don’t measure.
Run your initial disease burden analysis. This identifies which diseases are costing you money and how much. You’ll discover where your biggest opportunities for improvement exist. Most farms are surprised by what they find. The diseases they thought were their biggest problems often aren’t. The real costs are hiding in extended production losses from conditions they considered minor.
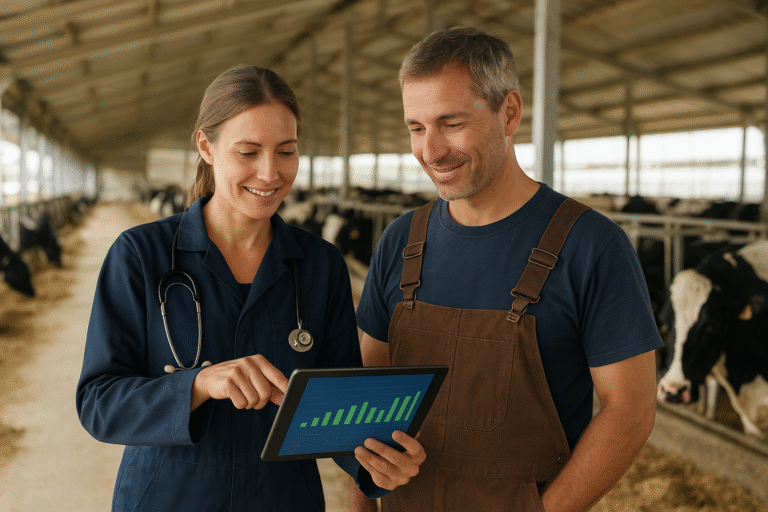
Generate your first cow performance rankings. This separates your herd into resilient animals, average performers, and problem cows. You’ll see exactly which animals are maintaining value despite health challenges and which ones are costing you money every day they stay in the herd.
Review findings with your veterinarian. Your vet knows your herd. Combine their clinical knowledge with the quantified data from these analyses. Together, you’ll align on which protocols are worth continuing, which need adjustment, and which aren’t delivering results.
At the end of six months, you’ll have a complete baseline understanding of disease costs and cow-level performance. This becomes your reference point for measuring all future improvements.
Step 2: Implement Your Selection Strategy (Months 6 to 18)
Once you know where you stand, it’s time to act. This phase is about changing your herd’s genetic composition through strategic breeding and culling.
Breed exclusively from your top 25 to 30% of cows. These are your resilient, productive animals. Every breeding decision should prioritize genetic improvement. This might mean not breeding some cows with decent milk weights if their health histories or recovery patterns show susceptibility. Stay disciplined about this. Short-term production from mediocre cows isn’t worth compromising your long-term genetic progress.
Cull your bottom 10 to 15%. Start with the worst performers. These are animals that are disease-prone and showing declining production. They’re not going to improve. Every month they stay in your herd, they’re consuming resources and reducing your herd average. Remove them strategically based on their current value and replacement availability.
Track monthly ranking changes. Rankings update every month as new production data and health events are recorded. Watch which animals maintain their top-tier status and which ones move between categories. This helps you identify animals on the cusp of culling or breeding decisions.
The first replacements from your improved breeding strategy will enter the milking herd around month 30 to 36 (accounting for breeding, gestation, and raising). But you’ll see improvements before then as you remove problem animals and focus resources on responsive cows.
Step 3: Monitor and Adjust (Months 18 to 36)
This is where you track progress and refine your approach based on results.
Rerun your disease burden analysis. Do this at 6 months and 12 months from your baseline. You should see measurable reductions in disease costs as you remove susceptible animals and improve protocols. If you’re not seeing improvement, the data will show you where adjustments are needed.
Watch the genetic shift in your rankings. As purpose-bred replacements enter the milking herd, you should see more animals in the top tier and fewer in the bottom. This confirms your breeding strategy is working. The percentage of your herd in each category should gradually shift toward more resilient animals.
Refine your breeding criteria as the herd improves. As your baseline improves, you can become more selective. What counted as top tier in year one might be average tier in year three. Continuously raising your standards maintains progress.
Timeline Expectations
Building genetic resilience takes time, but the milestones are predictable:
At 6 months: Measurable reduction in disease costs from culling worst performers and focusing management on responsive animals. This is your quickest return.
At 12 to 18 months: Improved herd average production as the percentage of problem animals decreases and resources concentrate on better cows. Management becomes noticeably easier.
At 24 to 36 months: Clear genetic shift visible in your rankings. More top-tier animals, fewer bottom-tier problems. This is when you’ll see the compounding effects of improved genetics plus improved management.
Most farms see positive ROI within the first year from reduced disease costs and improved efficiency. The genetic improvements in years two and three create lasting value that continues benefiting your operation for decades.
Ready to Build a Disease-Resilient Herd?
Stop guessing which cows are costing you money and which ones are building your future. Get a comprehensive analysis combining disease burden assessment with lifetime cow performance rankings.
We’ll show you exactly which animals demonstrate production resilience and which ones should be your breeding priorities.
Conclusion: Genetics You Can Pass to the Next Generation
We started this article talking about a $200,000 barn renovation that didn’t deliver the expected results. The problem wasn’t the barn. The problem was trying to manage around genetic susceptibility instead of breeding for genetic resilience.
Disease resilience isn’t about creating perfectly healthy cows that never face challenges. That’s impossible. Every cow will experience health events at some point, regardless of your facilities or protocols.
Disease resilience is about identifying and breeding cows that maintain high production despite those challenges. It’s about building a herd where genetics work with your management, not against it.
This approach requires patience. You won’t transform your herd in six months. But you will see measurable progress at every milestone. Reduced disease costs in the first year. Improved herd averages in year two. A genetic shift toward resilience by year three.
More importantly, you’ll build something lasting. Every generation gets stronger. Every breeding decision improves your baseline. The herd you pass to the next generation will be genuinely better than the one you manage today.
Your barn and facilities matter. Your protocols matter. But the genetics of the individual cows in your herd matter most. That’s where lasting improvement comes from.
From our family to yours, we built these tools to help reveal patterns hidden in your existing herd data. The information is already there in your records. Our tools help translate that data into clear insights about which cows demonstrate resilience and which breeding decisions will build lasting value for your operation.
That’s how you create a truly disease-resilient herd. Not by avoiding every health challenge, but by breeding animals that thrive despite them.
References
- Puerto, M.A., Shepley, E., Cue, R.I., Warner, D., Dubuc, J., and Vasseur, E. (2021). The hidden cost of disease: I. Impact of the first incidence of mastitis on production and economic indicators of primiparous dairy cows. Journal of Dairy Science, 104(7), 7932-7943. https://www.journalofdairyscience.org/article/S0022-0302(21)00510-5/fulltext
- Rasmussen, P., Barkema, H.W., Osei, P.P., Taylor, J., Shaw, A.P., Conrady, B., Chaters, G., Muñoz, V., Hall, D.C., Apenteng, O.O., Rushton, J., and Torgerson, P.R. (2024). Global losses due to dairy cattle diseases: A comorbidity-adjusted economic analysis. Journal of Dairy Science, 107(9), 6945-6970. https://www.journalofdairyscience.org/article/S0022-0302(24)00821-X/fulltext
- Warner, D., Dallago, G.M., Dovoedo, O.W., Lacroix, R., Delgado, H.A., Cue, R.I., Wade, K.M., Dubuc, J., Pellerin, D., and Vasseur, E. (2022). Keeping profitable cows in the herd: A lifetime cost-benefit assessment to support culling decisions. Animal, 16(10), 100628. https://www.sciencedirect.com/science/article/pii/S1751731122001859
- Han, R., Kok, A., Mourits, M., and Hogeveen, H. (2024). Effects of extending dairy cow longevity by adjusted reproduction management decisions on partial net return and greenhouse gas emissions: A dynamic stochastic herd simulation study. Journal of Dairy Science, 107(9), 6902-6912. https://www.sciencedirect.com/science/article/pii/S0022030224007689
Related Resources:
About DairyCommand
We’re a family team of veterinary and data science experts dedicated to helping dairy farmers build healthier, more profitable herds through lifetime analytics and disease burden quantification. From our family to yours, we turn complex data into clear decisions that last for generations.