The dairy industry generates enormous amounts of data: milk yields, health events, reproduction records. Yet most of this data remains underutilized. Farms track treatment costs but miss the extended milk production losses that disease causes across entire lactations.
This gap creates challenges for veterinary practices. You provide valuable strategic expertise beyond clinical treatment, but quantifying that value has been difficult. Both veterinarians and farmers want data-driven decisions with measurable ROI, but the tools haven’t existed.
That’s beginning to change. Modern dairy farm management software now makes invisible losses visible, transforming how veterinarians consult with dairy operations.
The Veterinary Revenue Challenge
Most dairy veterinarians work under herd health contracts or subscription models, providing routine visits, reproductive checks, and disease management for predictable monthly or annual fees. This model works well for standard services, but it creates a fundamental challenge: how do you capture the value of strategic advisory work that goes beyond routine care?
Traditional contracts cover the “what” (pregnancy checks, treatments, vaccinations) but not the strategic “why” and “how” (which diseases are costing the most, where to prioritize interventions, whether protocols are working). Your expertise extends far beyond clinical procedures, yet your revenue remains tied largely to herd expansion or adding more farms.
Meanwhile, farms collect enormous amounts of data through their herd management systems. All this information sits there, underutilized, while both you and your clients miss opportunities to turn data into decisions and decisions into measurable improvements.
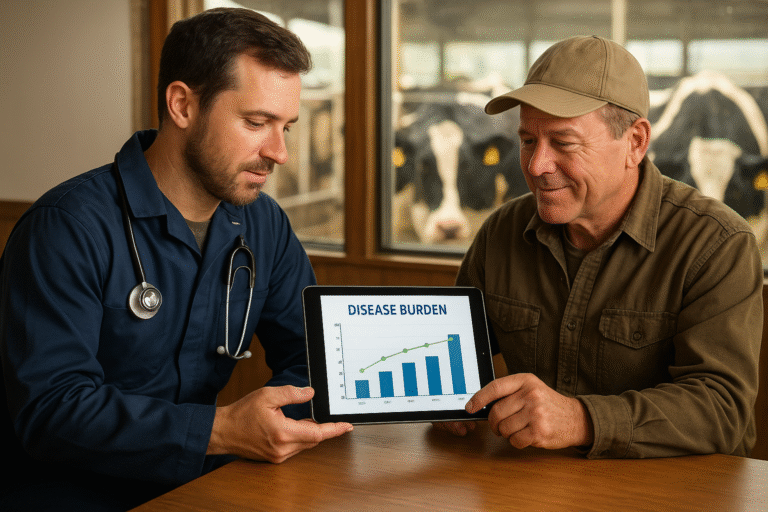
Disease burden analysis bridges this gap. It transforms underutilized farm data into quantified insights that create billable consulting services with demonstrable return on investment.
The Problem Most Dairy Veterinarians Face
Traditional dairy herd management focuses on what’s easy to measure: treatment costs, medication expenses, vet bills. But the real profit drain happens silently across entire lactations. A cow develops subclinical ketosis and quietly produces 2 to 3 liters less milk per day for months. That loss never shows up in the accounting books.
Your clients see the $180 treatment cost. They don’t see the $290 to $465 total economic loss from that single disease event. As a veterinarian, you understand the biology, but you’ve never had tools to quantify the economic impact for your clients.
This economic blind spot creates a fundamental problem for your practice. You want to help your clients improve herd health and profitability, but you lack the data to show them where their biggest opportunities exist.
Why Modern Dairy Management Software Matters for Veterinarians
The best dairy farm management systems do something remarkable: they quantify the invisible. By analyzing lifetime production records, health events, and lactation curves, these platforms reveal exactly how much milk (and therefore money) each disease costs your clients.
Take mastitis as an example. Your client knows the treatment cost and sees the discarded milk for a few days. What they don’t see is that cow producing 1.5 liters less per day for the rest of her lactation. Modern dairy cow management software analyzes this at multiple levels: cow-level impact, herd-level aggregation, five-year trend monitoring, and the crucial relationship between disease prevalence and milk loss.
This matters tremendously for your veterinary practice. When you can show a farmer that their current mastitis burden costs specific quantities of lost milk production annually, and your proposed prevention program costs a fraction of that to implement, the decision becomes obvious. You’ve moved from selling services to selling measurable outcomes.
The Game-Changing Capability: Prevalence vs. Milk Loss Analysis
Here’s the critical insight: disease prevalence alone doesn’t tell you whether management is working. What matters is the relationship between prevalence and milk loss.
When you improve disease diagnostics and treatment, several patterns can emerge. Prevalence may increase (you’re detecting cases earlier), prevalence may stay the same (detection unchanged, prevention working), or prevalence may decrease (effective prevention reducing case numbers).
But here’s what ALWAYS happens with improved management: milk losses decrease. That’s the key indicator.
Here’s a realistic example of what this looks like: After implementing enhanced ketosis monitoring, you would typically see prevalence rise from 15% to 22% (more cases detected early), while milk losses drop by 50% (early intervention prevents extended losses). Traditional monitoring would flag this as failure. Disease burden analysis reveals it as success.
Testing Interventions with Confidence
This monitoring cycle creates powerful opportunities for evidence-based protocol validation. Want to test a new vaccination program? Generate a baseline report, implement the vaccine protocol, then run a six-month follow-up. The analysis quantifies exactly how much milk loss decreased (or didn’t).
This approach works for any intervention: facility modifications, nutritional changes, staff training programs. Each intervention gets quantified outcomes. Did the new protocol work? By how much? The answers are measured, not assumed. This monitoring capability lets you refine protocols continuously, doubling down on what works and adjusting what doesn’t.
Expanding Your Service Offerings with Data-Driven Consulting
Disease burden analysis enables the evolution from traditional service delivery to integrated consulting models. Your herd health contracts already cover routine visits and clinical care. Disease burden monitoring becomes the strategic layer that quantifies impact and guides decision-making.
Every six months, you generate a disease burden analysis report for each client. This 30 to 60 minute consultation reviews which diseases cost the most in lost milk production, whether trends are improving or worsening, and where management changes should focus. You’re billing for strategic advice backed by quantified data, not just clinical treatment.
For practices using herd health contracts, disease burden analysis integrates seamlessly as a premium tier or value-added service. Some practices include one baseline analysis in annual contracts, with follow-up analyses billed separately. Others offer tiered packages: Standard (routine herd health), Enhanced (plus annual disease burden analysis), or Premium (plus bi-annual monitoring with intervention consulting).
A typical integrated consulting model might include: baseline analysis ($500 to $800), protocol development consultation ($600 to $1,200), six-month follow-up monitoring ($400 to $600). That’s $1,500 to $2,600 per farm annually in structured advisory fees, separate from your core clinical services.
Real Impact on Veterinary Practice Economics
Let’s talk numbers for your practice. Disease burden analysis creates measurable economic opportunities by quantifying what’s been invisible until now: milk that never makes it into the tank.
Consider a typical dairy operation of 300 to 400 cows. Research on disease-specific milk losses shows that farms this size routinely lose substantial production to common health conditions. A 400-cow operation faces these approximate annual milk losses: mastitis (clinical and subclinical combined) accounts for roughly 28,000 liters lost annually, ketosis costs another 18,000 liters, lameness reduces production by 15,000 liters, and metritis adds 9,000 liters in losses. Combined, this farm loses approximately 70,000 liters of milk annually to disease.
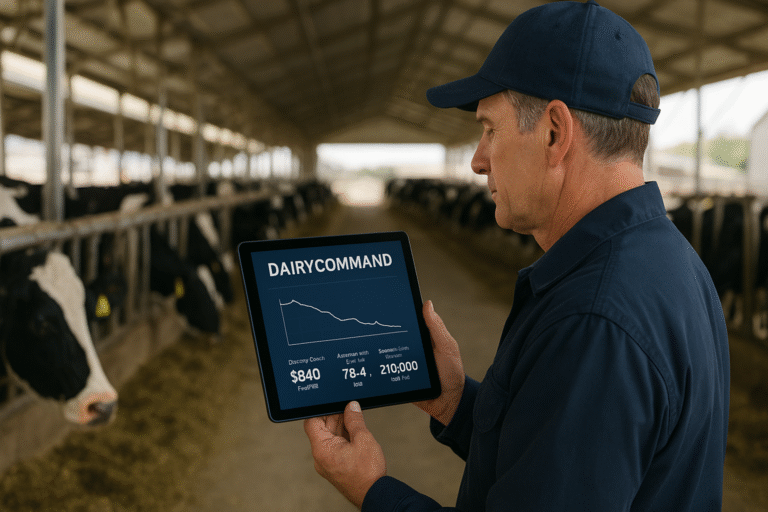
At current milk prices averaging $0.50 to $0.60 per liter, that’s $35,000 to $42,000 in unrealized revenue every year. These losses remain completely invisible in farm financial records.
Here’s how disease burden analysis transforms this situation. You generate a baseline report for a 400-cow client and quantify these hidden losses precisely. The analysis reveals 70,000 liters lost annually, with mastitis as the dominant factor at 28,000 liters. You develop a targeted strategy requiring approximately $8,000 to $10,000 in annual investment.
Six months later, follow-up analysis validates which specific interventions delivered results. The enhanced transition cow protocols reduced ketosis losses by 5,000 liters. The hygiene improvements cut mastitis losses by 8,000 liters. That’s 13,000 liters recovered in six months, worth $6,500 to $7,800, against an investment of $4,000 to $5,000 in the first half-year.
As protocols mature over the full year, total recovery reaches 20,000 to 25,000 liters annually, worth $10,000 to $15,000, against the $8,000 to $10,000 annual program cost.
The ROI becomes undeniable when framed in milk production: invest in prevention protocols, recover 20,000 plus liters of milk annually that was being lost to disease. This consulting model solves the predictability challenge both sides face. The farmer knows disease burden analysis costs a specific amount bi-annually with clear deliverables. You know you’re billing for measurable expertise, not just reactive treatment hours.
Over a year, one 400-cow client generates $1,500 to $2,600 in disease burden consulting fees alone, separate from treatment services. Scale this across 15 to 20 dairy clients, and you’ve added $22,500 to $52,000 in annual practice revenue from strategic advisory work that enhances rather than replaces your core services.
Transform Your Veterinary Practice
Ready to move from reactive treatment to strategic consulting? See how disease burden analysis creates new revenue opportunities while improving client outcomes.
What to Look for in Dairy Management Software
When evaluating options for your veterinary practice, focus on these essential features.
Lifetime analysis capability is crucial. Software that only analyzes current lactation or recent test days misses the extended losses that make up most disease costs. You need systems analyzing entire production histories, typically five years of data.
Disease-specific attribution separates good software from mediocre options. When a cow experiences multiple health events, the system must isolate individual disease effects rather than lumping everything together.
Integration with existing systems determines adoption success. The best software pulls data automatically from DairyComp or similar herd management platforms your clients already use.
Intervention monitoring over time closes the loop. Software should let you generate baseline reports, implement changes, and produce follow-up analyses showing whether your protocols worked.
Getting Started with Modern Dairy Farm Management
Start with your most progressive clients who already value data-driven decisions. These early adopters help you refine your consulting approach before scaling to your entire client base.
If you use herd health contracts, introduce disease burden analysis as an enhanced service tier. Frame it as: “We’re adding disease burden analysis to help you see exactly where health investments deliver the best return.” This positions it as an upgrade to existing services, not a separate expense.
Begin with 3 to 5 farms. Generate baseline reports showing current costs in liters of lost milk, identify the biggest opportunities, develop intervention strategies, and schedule six-month follow-ups to validate results.
Most practices price baseline analysis at $500 to $800 per farm. Follow-up analyses run $400 to $600. Farmers resistant to consulting fees respond well to this framing: “This analysis will identify hidden losses typically worth 60,000 to 80,000 liters of milk on a farm your size. The $500 investment shows you exactly where those losses occur so we can target interventions with measurable ROI.”
The key is starting. Every month you wait, your clients lose milk production to invisible disease costs while you miss opportunities to expand your practice beyond traditional treatment services.
See Disease Burden Analysis in Action
Schedule a personalized demo showing how veterinary practices use disease burden monitoring to create new revenue streams while delivering measurable client value.
Questions? Email us at info@signal2action.com to discuss how disease burden analysis fits your practice model.
Your Next Step
The veterinary profession is evolving. This future is already emerging. Progressive veterinary practices are building meaningful revenue streams from strategic consulting services that barely existed five years ago. As farms consolidate and compete globally, they increasingly need this level of analytical support, creating substantial growth opportunities for practices that embrace data-driven advisory roles.
Modern dairy farm management software isn’t replacing veterinary expertise. It’s amplifying it. You still bring clinical knowledge, diagnostic skills, and hands-on experience with herds. The software adds quantification, economic impact analysis, and intervention monitoring that transform how clients value your services.
From our family to yours, we understand the challenges you face as a veterinarian. You want to provide the best possible care for dairy herds while building a sustainable practice. Disease burden analysis creates that opportunity.
The dairy industry needs veterinarians who can bridge animal health and farm economics. Your clients need advisors who quantify problems, validate solutions, and demonstrate measurable results. Modern software gives you the tools to become that strategic partner.
Every farm you serve has hidden profit opportunities waiting to be discovered. Disease burden analysis reveals them. Your expertise turns them into action plans. Together, you can help dairy operations become more profitable, more sustainable, and better prepared for the next generation.
References
Rasmussen, P., Barkema, H.W., Osei, P.P., Taylor, J., Shaw, A.P., Conrady, B., Chaters, G., Muñoz, V., Hall, D.C., Apenteng, O.O., Rushton, J., and Torgerson, P.R. (2024). Global losses due to dairy cattle diseases: A comorbidity-adjusted economic analysis. Journal of Dairy Science, 107(9), 6945-6970. https://www.journalofdairyscience.org/article/S0022-0302(24)00821-X/fulltext
Puerto, M.A., Shepley, E., Cue, R.I., Warner, D., Dubuc, J., and Vasseur, E. (2021). The hidden cost of disease: I. Impact of the first incidence of mastitis on production and economic indicators of primiparous dairy cows. Journal of Dairy Science, 104(7), 7932-7943. https://www.journalofdairyscience.org/article/S0022-0302(21)00510-5/fulltext
Rollin, E., Dhuyvetter, K.C., and Overton, M.W. (2015). The cost of clinical mastitis in the first 30 days of lactation: An economic modeling tool. Preventive Veterinary Medicine, 122(3), 257-264. https://www.sciencedirect.com/science/article/pii/S0167587715300490
Raboisson, D., Mounié, M., and Khenifar, E. (2015). The economic impact of subclinical ketosis at the farm level: Tackling the challenge of over-estimation due to multiple interactions. Preventive Veterinary Medicine, 122(4), 417-425. https://www.sciencedirect.com/science/article/abs/pii/S0167587715002615
Cha, E., Hertl, J.A., Bar, D., and Gröhn, Y.T. (2010). The cost of different types of lameness in dairy cows calculated by dynamic programming. Preventive Veterinary Medicine, 97(1), 1-8. https://www.sciencedirect.com/science/article/abs/pii/S0167587710002102
Related Resources:
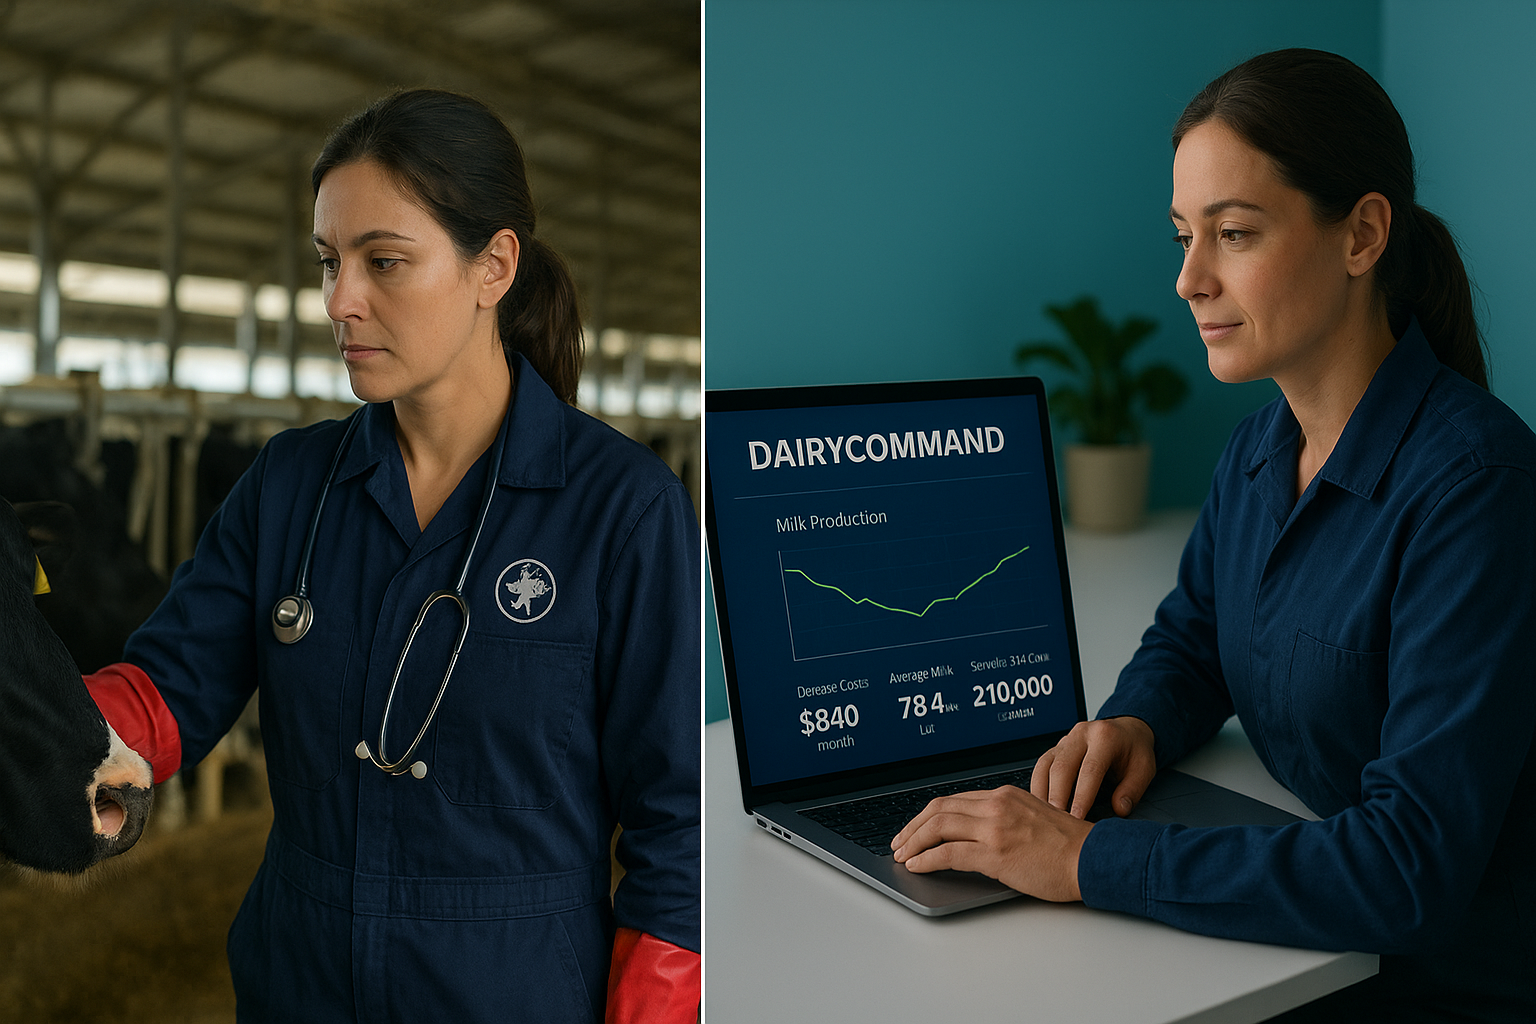
About DairyCommand
From our family to yours: we’re dairy people who understand that every cow represents an investment and every decision matters. DairyCommand combines veterinary science, data analytics, and practical farm experience to help you build a more profitable, sustainable operation. Learn more about our herd optimization tools at signal2action.com