Dairy Farm Management: Historical Data to Optimize Decisions
You keep detailed records. Every breeding decision, every culling choice, every health event gets logged in your dairy management system. But here’s the question most farmers never ask: What if those five years of records could show you exactly where you left money on the table?
Traditional dairy farm management treats historical data like a rearview mirror,useful for looking back, but not for steering forward. Yet your herd records contain hidden patterns that reveal optimization opportunities most farmers never see. When analyzed systematically, this data shows the gap between the decisions you made and the decisions that would have maximized profitability.
This isn’t about second-guessing your expertise. It’s about combining your on-farm knowledge with algorithmic analysis that considers factors simultaneously in ways the human brain simply can’t process. The result: a roadmap showing exactly which breeding and culling criteria to adjust for measurable herd improvement.
The Hidden Value in Your Historical Herd Data
Most dairy operations use herd management software to track current decisions. They record breedings, log health events, monitor production, and manage reproduction. But few farmers realize their historical data, particularly records spanning 5+ years, contains optimization insights that could fundamentally improve future profitability.
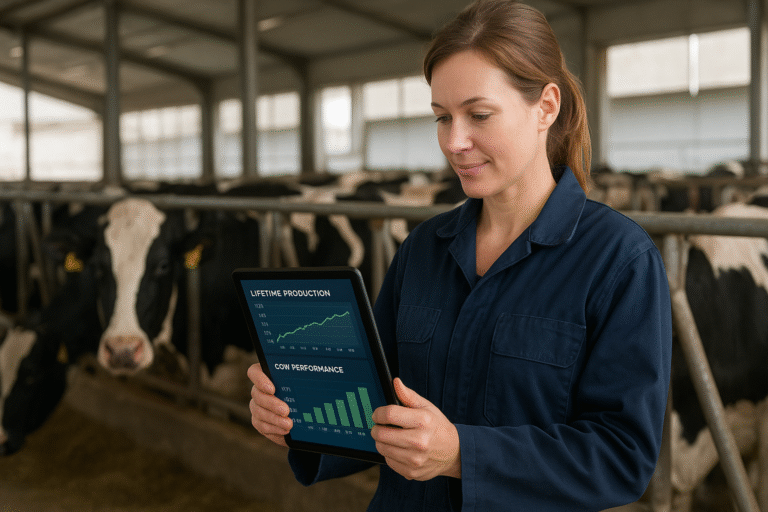
Research demonstrates that systematic analysis of lifetime production records reveals performance patterns invisible in snapshot evaluations. Studies show that lifetime trajectory modeling identifies consistent overperformers and chronic underperformers that current evaluation methods miss. When farmers understand these patterns, they make substantially better breeding and culling decisions.
The challenge: analyzing this data requires sophisticated statistical methods that account for interactions between health, genetics, reproduction, and production. Manual review can’t capture these multifactorial relationships. But algorithmic analysis can process your entire herd history, compare actual decisions against optimized strategies, and quantify exactly where opportunities exist.
Consider what your records already contain: breeding decisions for every cow over multiple lactations, culling choices with reasons and timing, health events with dates and treatments, production data across entire lifetimes, genetic evaluations updated annually. That’s comprehensive data waiting to be transformed into strategic intelligence.
How Historical Data Simulation Works
Historical data simulation takes your past 5 years of herd records and runs a powerful optimization algorithm to answer one critical question: What if you’d made different breeding and culling decisions?
The process starts by analyzing every cow in your herd across multiple decision factors. For breeding decisions, the system examines health scores (integrating lifetime disease resilience and production data), genetic indices like LPI, reproductive efficiency measured by days to conceive, lactation numbers indicating maturity and experience, and overall lifetime milk production potential. For culling decisions, it evaluates these same factors but from the perspective of when cows should exit the herd for maximum economic benefit.
Here’s what makes this analysis different from traditional approaches: the algorithm doesn’t evaluate traits in isolation. Research on dairy herd economics shows that successful breeding and culling strategies must account for trait interactions and correlations (Han et al., 2024). A cow with excellent genetics but poor health isn’t the same breeding candidate as a cow with excellent genetics and robust health. The algorithm considers these multifactorial relationships simultaneously.
The system then compares your actual decisions against what an optimized strategy would have recommended. For each year in your 5-year dataset, it identifies which cows you bred versus which cows the algorithm would have prioritized, and which cows you culled versus optimal culling candidates. The gap between your approach and the optimized strategy reveals specific opportunities for improvement.
Understanding the Comparative Analysis
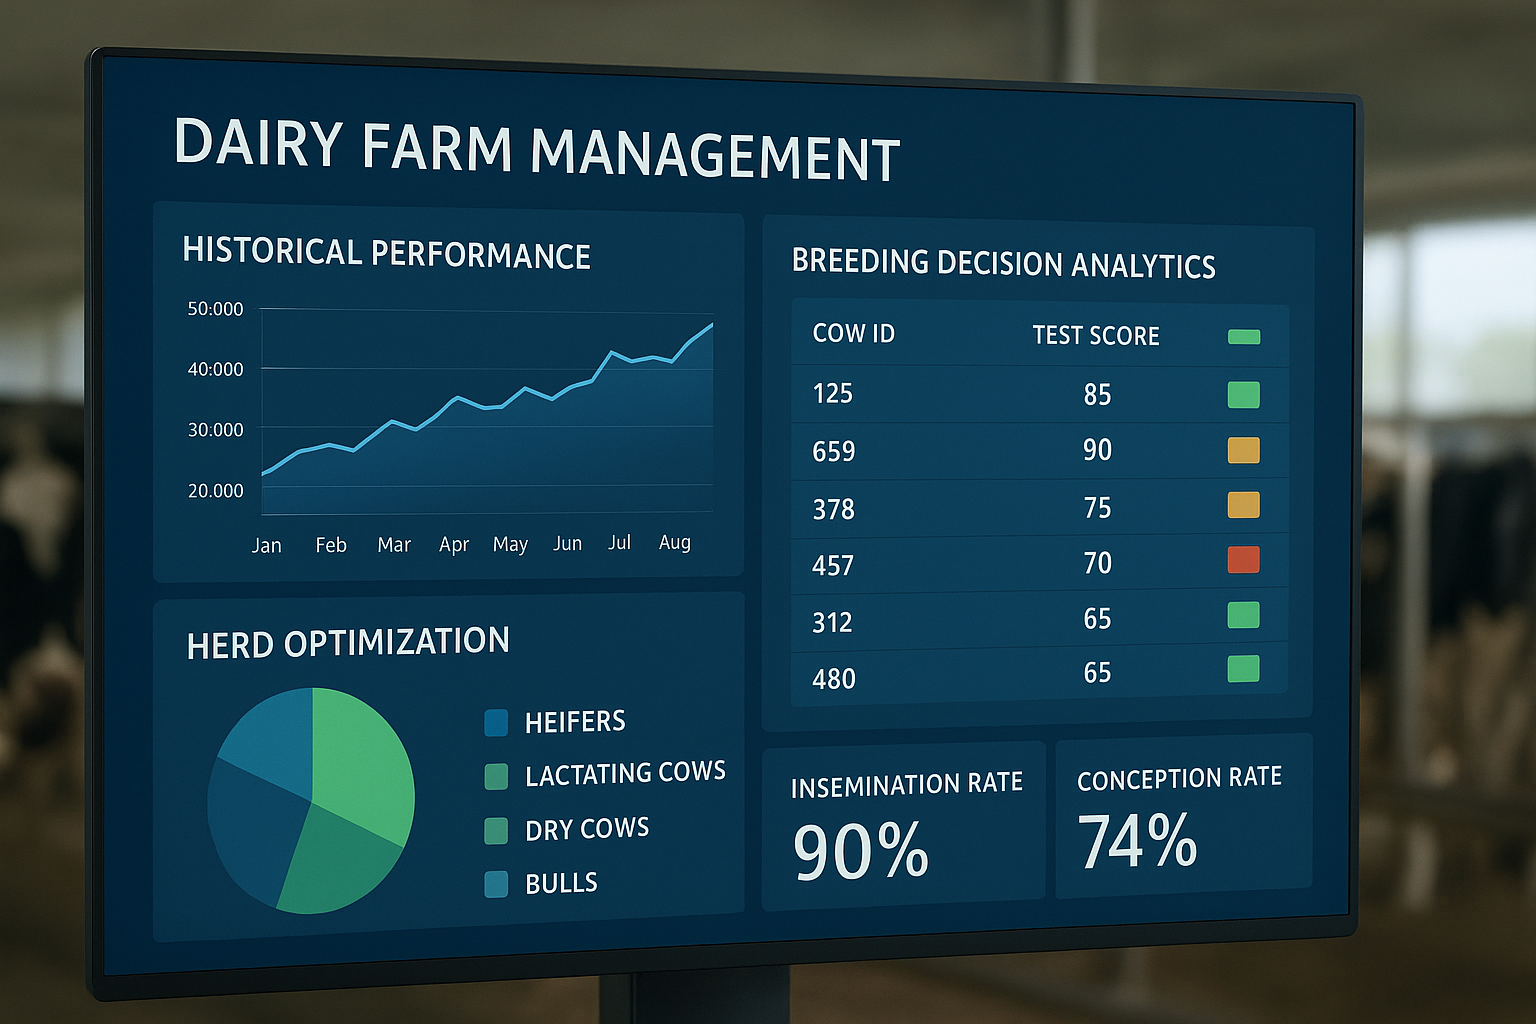
When you receive a historical optimization analysis, you’ll see detailed comparisons showing average values for key decision factors. For breeding decisions, you might discover your bred cows averaged 2.1 lactations while the algorithm favored cows averaging 2.8 lactations. Or you might find your bred animals had average health scores of 72/100 while optimized selections averaged 84/100. These gaps aren’t criticisms, they’re optimization opportunities.
For culling decisions, the analysis might reveal you retained cows for an average of 3.2 lactations while the optimized strategy would have culled them at 2.4 lactations. Or it could show your culled animals had average lifetime production of 45,000 pounds while the algorithm would have prioritized different animals with lower production potential. Each comparison includes statistical confidence intervals showing whether differences are meaningful.
The analysis also projects what your herd would have achieved under optimized management. You’ll see year-by-year comparisons of actual versus optimized milk production, actual versus optimized herd size (typically revealing opportunities to produce the same or more milk with 5-10% fewer animals), and the cumulative economic impact of decision gaps. For a 100-cow herd, these projections often identify $15,000-25,000 in annual improvement potential.
Key Decision Factors the Algorithm Evaluates
To understand your optimization report, you need to know what factors drive the algorithm’s recommendations. These aren’t arbitrary metrics, they’re scientifically validated indicators of long-term cow profitability and herd performance.
Health Score: The Foundation of Profitability
The proprietary Health Score integrates lifetime disease history, genetic disease resistance traits, and production consistency. Research confirms that disease burden substantially impacts lifetime profitability (Rasmussen et al., 2024). Cows with higher health scores demonstrate disease resilience, they avoid or recover quickly from health challenges while maintaining production.
When the algorithm suggests breeding cows with higher health scores, it’s prioritizing animals likely to pass disease resilience to the next generation. When it recommends culling cows with persistently low health scores, it’s identifying animals whose health challenges consistently reduce profitability. Your historical data shows exactly where these patterns exist in your herd.
Genetic Potential: LPI and Beyond
Lifetime Performance Index (LPI) and similar genetic evaluations predict offspring potential. But genetic indices alone don’t determine breeding priority, the algorithm balances genetic potential against health, reproduction, and actual production performance. A cow with excellent genetics but poor reproductive efficiency or chronic health issues may not be an optimal breeding candidate despite high LPI scores.
Historical analysis reveals whether your breeding decisions appropriately weighted genetic indices against other performance factors. You might discover you consistently bred high-LPI cows regardless of health or reproduction, when optimal strategy would have selected moderate-LPI animals with superior health and efficiency. These insights help refine breeding criteria for future decisions.
Reproductive Efficiency: Days to Conceive
Reproductive efficiency directly impacts farm economics through reduced breeding costs, improved genetic gain, and optimized lactation timing. Studies demonstrate that reproductive performance significantly affects dairy operation profitability (Dos Santos et al., 2025). Cows requiring excessive breeding attempts consume resources while delaying the next lactation.
The algorithm examines average days to conceive for your breeding selections. If your bred cows averaged significantly more days open than optimized selections would have, it suggests incorporating reproductive efficiency more heavily in breeding criteria. For culling decisions, persistently open cows with poor reproductive history may be candidates for earlier removal.
Lactation Number: Experience and Maturity
Lactation number reflects cow maturity and productivity trajectory. First-lactation heifers show potential but haven’t proven longevity. Mature cows in later lactations demonstrate resilience but may be approaching natural decline. The optimal breeding and culling strategy balances these factors based on individual performance.
Historical analysis might reveal you consistently bred younger cows (average 2.0 lactations) while the algorithm would have selected more mature animals (average 2.6 lactations) with proven production and health records. This doesn’t mean older is always better, it means your specific herd data suggests mature proven performers deserved higher breeding priority given their track records.
Lifetime Production: The Ultimate Measure
Total lifetime milk production reflects cumulative cow value. High lifetime producers generate more revenue per day of herd occupancy. But lifetime production must be considered alongside health costs, reproductive efficiency, and genetic potential. The algorithm weighs these factors together.
Your analysis will show average lifetime production for both your breeding and culling selections compared to optimized choices. Large gaps indicate opportunities to better align decisions with long-term profitability. A cow with moderate current production but excellent lifetime cumulative output might be a better breeding candidate than a flashy first-lactation heifer with unproven longevity.
Interpreting Your Historical Optimization Report
When you receive your historical simulation analysis, you’ll get comprehensive tables, visual comparisons, and statistical breakdowns. Here’s how to extract maximum value from the report.
The Executive Summary: Start Here
Your report begins with an executive summary highlighting the biggest opportunities. This section shows cumulative potential improvements: projected increase in milk production if optimized decisions had been implemented (typically 1-2% for most herds), potential reduction in herd size while maintaining production (often 5-10% fewer animals), and estimated annual economic impact of closing decision gaps (frequently $15,000-25,000 for 100-cow operations).
The executive summary also identifies your top three decision pattern adjustments. These might be things like “Breed cows with higher health scores (algorithm avg: 84/100 vs. your avg: 72/100)” or “Cull cows earlier when reproductive efficiency declines (algorithm avg: 2.4 lactations vs. your avg: 3.2 lactations).” These specific, actionable insights guide immediate strategy changes.
Year-by-Year Performance Tables
Your report includes comprehensive tables showing actual versus optimized performance for each year in the 5-year analysis. For milk production, you’ll see what you actually achieved and what optimized decisions could have produced. The gap quantifies opportunity cost, milk you could have produced with better cow selection.
For herd size, the tables show your actual animal numbers versus the optimized herd size that would have achieved equivalent or better production. If the algorithm consistently suggests 5-8% fewer animals, that’s a persistent efficiency opportunity. Smaller herds with equivalent production mean lower feed costs, reduced labor, less facility wear, and improved per-cow profitability.
Pay special attention to trend lines. If optimization gaps are widening over time, your decision patterns are diverging further from optimal strategy. If gaps are narrowing, you’re naturally moving toward better decisions. These trends reveal whether intuitive adjustments are working or whether systematic changes are needed.
Decision Factor Breakdown: The Details Matter
The most valuable section for strategy development is the detailed decision factor analysis. This breaks down breeding and culling choices by every major factor the algorithm evaluates.
For breeding decisions, you’ll see separate analyses of health scores, genetic indices, days to conceive, lactation numbers, and lifetime production. Each comparison shows your average values versus algorithm-optimized averages, with confidence intervals indicating statistical significance. Large, statistically significant gaps represent priority improvement areas.
If your bred cows averaged 115 days to conceive while optimized selections averaged 87 days, that’s a clear signal: you’re underweighting reproductive efficiency in breeding criteria. If your bred animals had average health scores 12 points lower than optimal selections, you’re missing an opportunity to breed disease-resilient genetics into the next generation.
For culling decisions, the analysis reveals whether you’re retaining or removing the right animals at the right time. You might discover you’re culling cows too early (removing animals that still had profitable production ahead) or too late (keeping cows past their optimal economic contribution). The algorithm quantifies exactly where these timing opportunities exist.
Visual Analytics: See the Patterns
Your report includes multiple visualizations making patterns immediately obvious. Trend graphs show how actual versus optimized performance evolved over five years.
Implementing Improvements: The Practical Path Forward
Historical optimization analysis isn’t academic, it’s a practical roadmap for immediate strategy adjustments. Here’s how to translate insights into action on your farm.
Prioritize High-Impact Changes First
Your report identifies multiple optimization opportunities. Start with changes offering the largest potential impact and requiring the least operational disruption. If the analysis shows breeding cows with higher health scores could improve herd disease resilience substantially, that’s often a straightforward adjustment. Your existing records already include health histories, you just need to weight this factor more heavily in breeding decisions.
Similarly, if the algorithm reveals culling timing opportunities (you’re keeping certain cow profiles too long), implementing earlier culling for specific categories is relatively simple. You’re not changing fundamental management, you’re refining criteria within your existing system.
More complex changes might involve reproductive protocol adjustments or facility modifications enabling better health outcomes. Tackle these secondary improvements once initial high-impact changes are producing results.
Integrate Findings with Individual Cow Rankings
Historical optimization analysis works at the herd level, revealing broad decision patterns. But implementation happens cow by cow. This is where individual cow performance rankings become invaluable. When the analysis shows you should breed cows with higher health scores, cow-level rankings identify specifically which animals meet those criteria this month.
Similarly, if the report suggests culling certain cow profiles earlier, individual rankings flag which current cows fit those profiles. This combination of herd-level strategic insight and cow-level tactical implementation creates a complete decision-support framework. You know what to change (from the optimization analysis) and which cows to act on (from individual rankings).
Monitor Progress Through Annual Re-Analysis
Historical optimization is not a one-time exercise. Each year, you can re-run the analysis incorporating the most recent data. This creates a feedback loop showing whether your adjusted strategies are working. If optimization gaps narrow year over year, your changes are producing measurable improvement. If gaps remain static or widen, further refinements are needed.
Annual re-analysis also accounts for changing conditions. Economic factors, facility improvements, genetic advancements, and management evolutions all affect optimal strategy. What worked five years ago might not be optimal today. Regular re-analysis ensures your decision criteria evolve with your operation.
Research confirms that reproductive and management decision adjustments can substantially extend cow longevity and improve net returns (Han et al., 2024). Your annual re-analysis quantifies these improvements, providing concrete evidence that strategy changes are delivering the intended results.
Collaborate with Your Veterinarian and Advisors
Historical optimization analysis opens new opportunities for veterinary and consultant involvement in herd management. Traditionally, breeding and culling decisions stay firmly in farmer territory. But when you have data-driven insights showing specific improvement opportunities, veterinarians and consultants can provide valuable strategic guidance.
Your vet might review the health score analysis and recommend specific disease prevention protocols that would improve future breeding candidates’ health indices. A reproductive consultant could suggest adjustments to breeding protocols based on the days-to-conceive analysis. A nutritionist might identify feeding strategies supporting cows with the genetic and production profiles the algorithm favors.
This collaborative approach combines your intimate knowledge of individual cows and on-farm realities with expert perspectives on health, reproduction, and genetics. The optimization analysis provides an objective foundation for strategic discussions, moving beyond anecdotal observations to quantified opportunities.
Set Realistic Expectations for Timeline
Herd optimization is a gradual biological process. Don’t expect immediate transformation. After implementing strategy adjustments based on your analysis, measurable changes typically unfold over 12-24 months for initial improvements (as your adjusted breeding and culling criteria affect herd composition), 2-4 years for substantial progress (as first-generation cattle bred under optimized criteria enter production), and 5+ years for full optimization (as multiple generations of strategically selected cattle comprise the majority of your herd).
Timeline depends heavily on your starting point. Herds with many high-performing animals see faster improvement because there’s more genetic quality to build on. Herds with fewer top performers require longer timelines, as it takes additional generations to establish superior genetics. In these cases, strategic purchase of high-quality replacement animals can accelerate progress.
The key insight: herd optimization is a journey, not an event. Your historical analysis provides the roadmap. Disciplined implementation guided by annual re-analysis ensures steady progress toward maximum profitability and sustainability.
Understanding the Science Behind the Algorithm
To trust historical optimization analysis, you need to understand the scientific foundation. This isn’t marketing hype, it’s rigorous methodology applied to your specific herd data.
Multifactorial Decision Modeling
The algorithm’s power lies in simultaneously considering interactions between health, genetics, reproduction, and production. Human decision-makers struggle with this because our brains can’t process multiple correlated variables simultaneously. We tend to focus on one or two factors (often genetics and current production) while underweighting others.
The algorithm evaluates every possible correlation. It knows that cows with excellent genetics but poor reproductive efficiency have different long-term value than cows with moderate genetics and superior reproductive performance. It recognizes that health resilience affects lifetime production more than any single lactation’s output. These multifactorial relationships drive its breeding and culling recommendations.
Research on dairy cow longevity demonstrates that animal health status and farmer investment decisions interact to substantially affect economic herd performance (Owusu-Sekyere et al., 2023). The algorithm captures these complex interactions that intuitive decision-making often misses.
Within-Herd Benchmarking
Your analysis doesn’t compare your herd to external benchmarks or industry averages. It compares your decisions against optimal decisions within your own herd given your specific genetic base, facilities, management, and historical conditions. This within-herd benchmarking eliminates variables beyond your control and focuses purely on decision optimization opportunities within your operation.
If the algorithm suggests breeding different cows than you selected, it’s not because those cows meet some external ideal. It’s because within your herd, given your specific circumstances, those animals offered better long-term profitability based on their complete performance profiles. This contextual analysis respects that every farm operates under unique conditions.
Within-herd benchmarking also means you’re competing against your own potential, not against operations with vastly different resources, genetics, or market conditions. The question isn’t “How do you compare to the top 10% of farms?” It’s “How close are you to your own maximum potential given your specific situation?” That’s a far more actionable and achievable goal.
Statistical Rigor and Confidence Intervals
Every comparison in your report includes statistical measures showing whether differences are meaningful or just random variation. When the analysis shows your bred cows averaged 72/100 health score versus the algorithm’s 84/100, confidence intervals tell you if that 12-point gap is statistically significant.
Large confidence intervals that overlap between your selections and algorithmic recommendations indicate no meaningful difference, your decisions aligned well in that area. Non-overlapping confidence intervals with large gaps indicate clear optimization opportunities where your decision criteria should be adjusted.
This statistical rigor prevents false positives. You won’t waste time chasing improvement opportunities that don’t actually exist. The analysis only highlights differences large enough and consistent enough to represent genuine optimization potential.
Addressing Common Questions and Concerns
Farmers reviewing their first historical optimization analysis often have similar questions. Here are answers to the most common concerns.
“The Algorithm Doesn’t Know My Cows Like I Do”
Absolutely correct. You observe daily cow behavior, facility compatibility, temperament, family lines, and a hundred other factors that never appear in data. The algorithm can’t see that cow #1247 is aggressive in the parlor, or that cow #892’s daughter consistently outperforms her dam’s genetics.
This is precisely why the analysis provides opportunities, not mandates. You retain complete decision authority. When the algorithm suggests different breeding selections, it’s showing patterns in the data. You evaluate whether those patterns align with on-farm realities. Maybe the algorithm recommends breeding a cow you know has chronic hoof issues that aren’t fully captured in health records, your knowledge overrides the data.
The goal isn’t replacing farmer expertise with algorithmic decisions. It’s augmenting your knowledge with pattern recognition that processes more variables than human cognition can handle simultaneously. You make final decisions. The algorithm reveals blind spots.
“Won’t This Take Years to See Results?”
Yes, substantial herd transformation does take years, that’s the biological reality of dairy genetics. You can’t change a herd’s genetic composition overnight. But you’ll see incremental improvements continuously along the way.
Within 12 months of implementing adjusted breeding criteria, you’ll have a new crop of heifer calves with genetics and maternal characteristics aligned with optimization goals. Within 24 months, those heifers enter the milking herd, immediately improving average herd performance. Within 36 months, you’ll have multiple age groups reflecting optimized selection. Progress compounds annually.
Some improvements happen faster. Adjusted culling timing can improve herd efficiency within the current lactation. Better breeding candidate selection affects pregnancy rates and reproductive efficiency immediately. These short-term gains provide early validation while genetic improvements accumulate in the background.
“My Herd Is Already Pretty Good, Will This Even Help?”
High-performing herds often find substantial optimization opportunities precisely because they’re already good. When you’re operating at 85% of potential, finding that remaining 15% requires sophisticated analysis. Historical simulation excels at identifying subtle patterns excellent managers miss.
You might discover you’re consistently choosing between two groups of top performers, but slight differences in health resilience or reproductive efficiency mean one group offers marginally better long-term value. Over time, consistently choosing the marginally better option compounds into significant herd improvement. That’s optimization at the margin, where high-performing operations compete.
Studies examining high-lifetime-production cows reveal that consistent overperformers share specific intrinsic characteristics often invisible in standard evaluations (Van Eetvelde et al., 2021). Historical optimization helps you identify and prioritize these characteristics in your breeding and retention decisions.
“What If I Can’t Afford to Make Big Changes?”
Most optimization improvements require zero capital investment. You’re not building new facilities or buying expensive equipment. You’re adjusting which cows get bred each month and which animals become culling priorities each quarter. Those decisions happen already, optimization just refines the criteria.
Some farmers worry they’ll need to purchase expensive replacement genetics to implement recommendations. That’s rarely necessary. The analysis identifies optimization opportunities within your existing herd. You’re already making breeding and culling decisions monthly. The only change is slightly adjusting selection criteria based on data-driven insights rather than intuition alone.
The financial investment is the analysis itself. The implementation is primarily discipline, consistently applying refined criteria in decisions you’re making anyway. For most farms, the analysis pays for itself within one breeding season through improved cow selection avoiding costly mistakes.
The Bottom Line: From Historical Records to Future Profitability
Your five years of herd records represent a gold mine of strategic intelligence most farmers never extract. Traditional dairy farm management treats this data as compliance documentation and historical reference. But when analyzed systematically through historical optimization simulation, these records reveal exactly where decision pattern adjustments could improve profitability.
The process is straightforward: your historical data gets analyzed by a powerful multifactorial algorithm that compares your actual breeding and culling decisions against optimized strategies. You receive a comprehensive report showing specific gaps, quantified opportunities, and actionable recommendations. You implement priority changes, typically starting with breeding candidate selection criteria and culling timing adjustments. Annual re-analysis tracks progress and refines strategies as your herd evolves.
The economic impact is measurable. Research demonstrates that extending dairy cow longevity through adjusted reproduction management decisions can substantially improve net returns while reducing greenhouse gas emissions (Han et al., 2024). For most herds, historical optimization analysis identifies $15,000-25,000 in annual improvement opportunities. Over five years, that’s $75,000-125,000 in additional profitability from refined decision-making, without requiring facility changes, equipment purchases, or operational disruptions.
This isn’t about perfect decisions. It’s about consistently better decisions that compound over time. Each breeding season where you select slightly better candidates. Each quarter where you prioritize culling animals whose data profiles suggest they’re past optimal economic contribution. These incremental improvements accumulate into substantial herd transformation.
Your records contain the roadmap. Historical optimization analysis reads it for you, translating five years of data into a strategic plan for the next five years. From our family to yours: if you’ve been keeping good records, you’re sitting on insights that could fundamentally improve your farm’s profitability. The question is whether you’ll extract that value or leave it buried in historical databases.
Ready to discover what your herd records reveal about optimization opportunities? Request a historical herd simulation analysis and see exactly where adjusted breeding and culling criteria could improve your operation’s performance.
References
Dos Santos, J.B., de Freitas, B.W., Obando, I.A.M., de Oliveira, N.D., Penitente-Filho, J.M., Moreira, M.V.C., Lobato, A.N., and Guimarães, J.D. (2025). Reproductive traits and economic aspects on dairy cattle. Animal Reproduction, 22(1), e20240050. https://doi.org/10.1590/1984-3143-AR2024-0050
Han, R., Kok, A., Mourits, M., and Hogeveen, H. (2024). Effects of extending dairy cow longevity by adjusted reproduction management decisions on partial net return and greenhouse gas emissions: A dynamic stochastic herd simulation study. Journal of Dairy Science, 107(9), 6902-6912. https://www.sciencedirect.com/science/article/pii/S0022030224007689
Owusu-Sekyere, E., Hansson, H., and Telezhenko, E. (2023). Dairy cow longevity: Impact of animal health and farmers’ investment decisions. Journal of Dairy Science, 106(5), 3207-3220. https://www.journalofdairyscience.org/article/S0022-0302(23)00162-5/fulltext
Rasmussen, P., Barkema, H.W., Osei, P.P., Taylor, J., Shaw, A.P., Conrady, B., Chaters, G., Muñoz, V., Hall, D.C., Apenteng, O.O., Rushton, J., and Torgerson, P.R. (2024). Global losses due to dairy cattle diseases: A comorbidity-adjusted economic analysis. Journal of Dairy Science, 107(9), 6945-6970. https://www.journalofdairyscience.org/article/S0022-0302(24)00821-X/fulltext
Van Eetvelde, M., Verdru, K., de Jong, G., van Pelt, M.L., Meesters, M., and Opsomer, G. (2021). Researching 100 t cows: An innovative approach to identify intrinsic cows factors associated with a high lifetime milk production. Preventive Veterinary Medicine, 193, 105392. https://www.sciencedirect.com/science/article/pii/S0167587721001367
Related Resources:
About DairyCommand
From our family to yours: we’re dairy people who understand that every breeding decision and every culling choice shapes your farm’s future. DairyCommand combines veterinary science, advanced data analytics, and practical farm experience to help you build a more profitable, sustainable operation. Our historical herd optimization analysis transforms five years of records into a strategic roadmap for continuous improvement. Learn more about our herd optimization tools at signal2action.com