A dairy farmer asks you during a routine herd visit: “Is our new mastitis protocol working?” You’ve observed fewer clinical cases over the past six months, but can you quantify the impact? Without structured data analysis, veterinarians often lack the appropriate tools to document specific intervention outcomes. With disease burden analysis, you can show them a documented 10,000-liter reduction in milk losses.
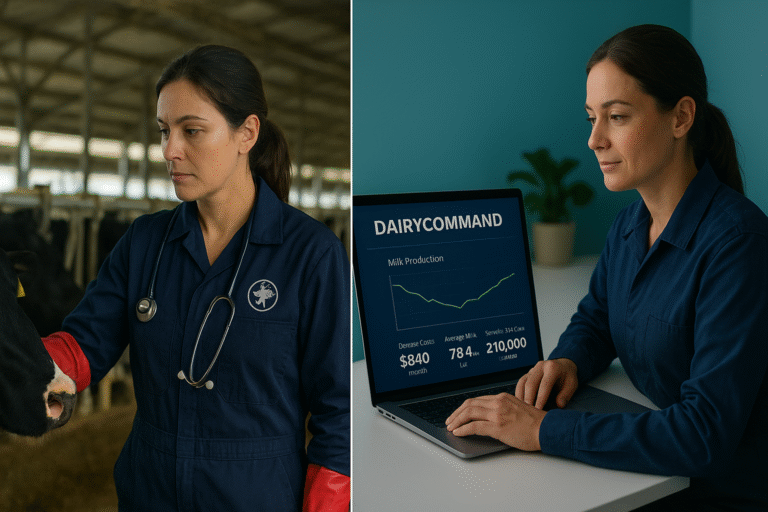
Veterinary herd health programs generate massive amounts of data: test-day records, treatment events, disease diagnoses, reproduction metrics, and production figures. Yet during consultations, this wealth of information often stays fragmented. Farmers see prevalence numbers alongside milk loss figures but may not have tools to connect these to their management decisions and profitability goals, while veterinarians need efficient ways to translate clinical observations into economic terms within the constraints of a 30-60 minute visit.
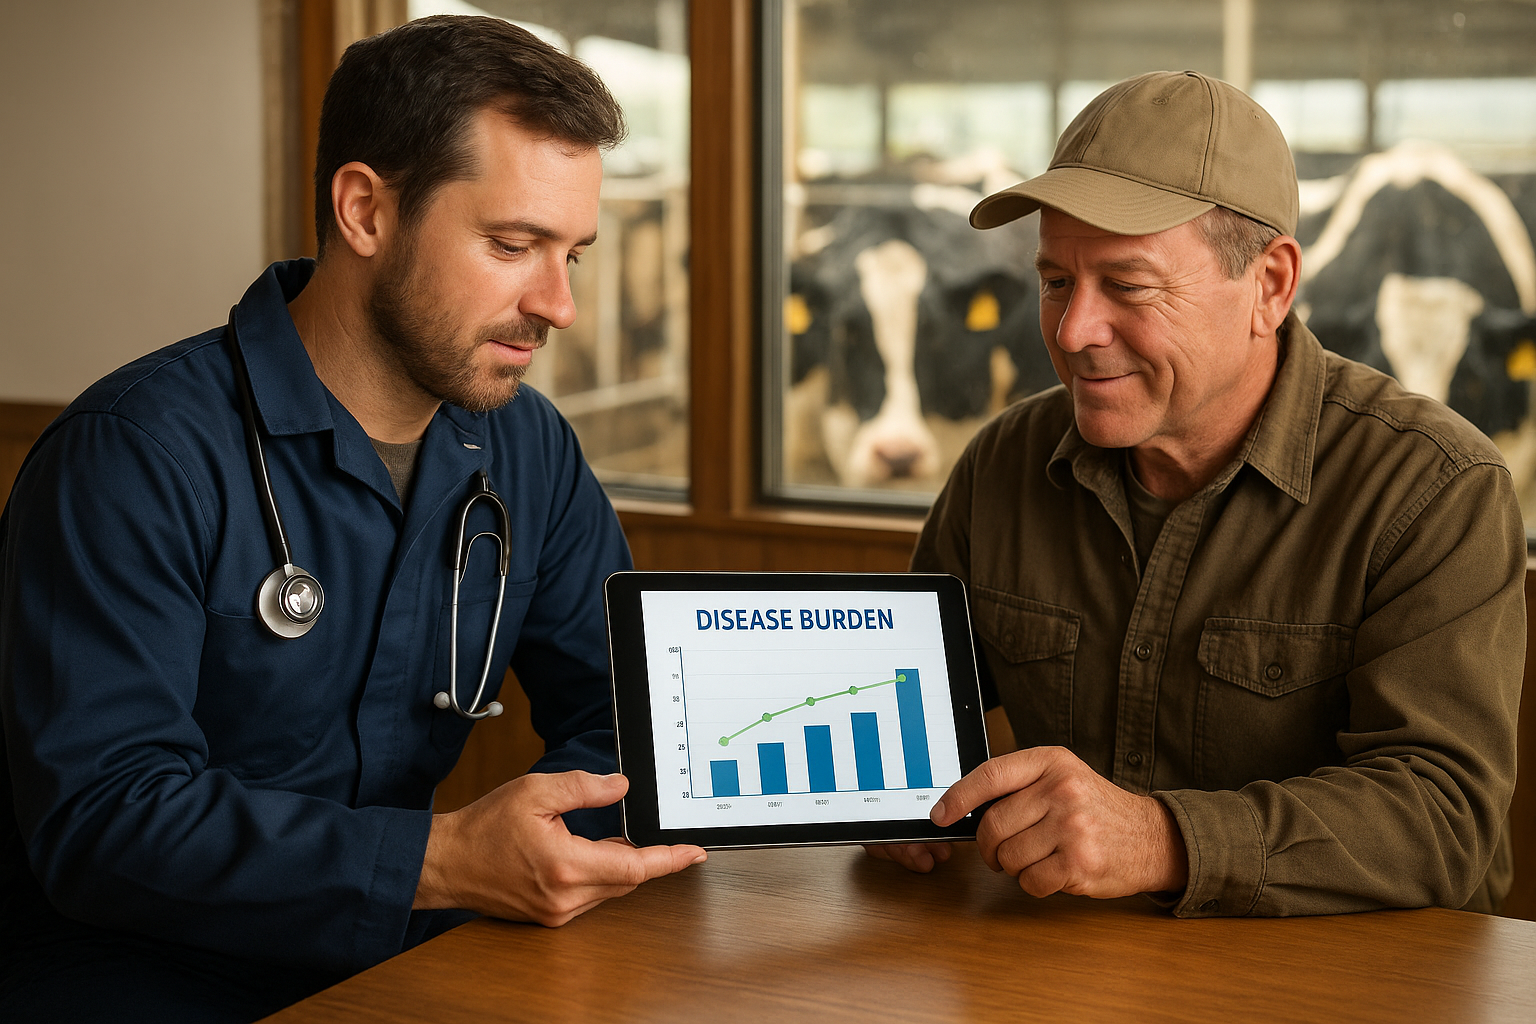
Disease burden analysis addresses this challenge by condensing data complexity into actionable insights: quantified milk losses by specific disease over defined time periods. This gives veterinarians a structured approach to discussing herd health economics during routine consultations, complementing clinical expertise with evidence-based insights that strengthen the advisory relationship.
From Fragmented Data to Consultation Clarity
The consultation challenge facing dairy veterinarians is not a lack of data. Most herds generate hundreds of data points weekly through automated milk recording systems, treatment logs, and reproductive tracking. The challenge is having the right tools to transform this fragmented information into insights that can guide management decisions during limited client interaction time.
Most herd data exists in silos. Milk yield reports sit in one system, health event records in another, and reproduction data in a third. Disease incidence or prevalence alone doesn’t convey true herd impact. A farm might track that 18% of cows experienced mastitis in the last six months, but this percentage doesn’t directly answer questions about milk production impact or profitability.
Disease burden analysis condenses this complexity into economically meaningful outputs. Rather than discussing case counts or prevalence percentages separately, you can present milk losses per disease, per herd, quantified over a specific six-month cycle. Research has documented that subclinical disease losses often exceed the visible costs of clinical treatment (Puerto et al., 2021). By quantifying these impacts alongside prevalence data, you provide insights that directly informs farm management decisions around animal health, genetics, disease resilience, and profitability.
The veterinarian serves as the essential bridge between three domains: data, disease, and decision. The analytical tool provides the foundation by processing thousands of records and calculating disease-specific milk losses. However, the tool cannot interpret farm-specific context. Your clinical expertise gives these numbers meaning by linking them to real management conditions, seasonal factors, facility constraints, breeding strategies, and the farmer’s operational goals around herd health and genetic improvement.
This integration transforms the veterinarian-farmer dialogue into an evidence-based partnership. Rather than discussing interventions based solely on clinical observations or farmer intuition, conversations become grounded in quantified herd insights that addresses both immediate health concerns and long-term goals around disease resilience and sustainable profitability. This reinforces your role not just as a clinician treating individual animals, but as an advisor guiding strategic herd management decisions.
Preparing for Consultations: Converting Data to Insights
Effective use of disease burden data during consultations begins before you arrive at the farm. The preparation phase transforms raw analytical outputs into focused talking points that can drive productive conversations within your limited client interaction time.
Run the disease burden analysis one to two days before your scheduled herd visit. This timing allows you to review outputs thoroughly rather than interpreting them on the spot during the consultation. Focus first on the one-page summary that shows total herd milk losses and identifies the top disease contributors. In a 400-cow herd, you might see results indicating that ketosis accounted for 12,000 liters of milk loss over the last six months, while mastitis contributed 25,000 liters and lameness 18,000 liters.
Compare current results to baseline data or the previous six-month cycle. This comparison reveals trends that matter more than absolute numbers. If ketosis losses increased from 8,000 liters to 12,000 liters between cycles, this signals a problem worth investigating—particularly if the farmer has goals around improving metabolic health and disease resilience in their herd. Conversely, if mastitis losses dropped from 32,000 liters to 25,000 liters following a protocol change, you have concrete evidence of intervention effectiveness that addresses both immediate profitability and longer-term herd health goals.
Identify two to three key talking points rather than attempting to discuss every data point. In the example above, your primary talking point becomes transition cow management related to ketosis and metabolic health. This focused approach prevents overwhelming farmers with information and ensures the consultation centers on actionable priorities that align with their goals for herd health and disease resilience.
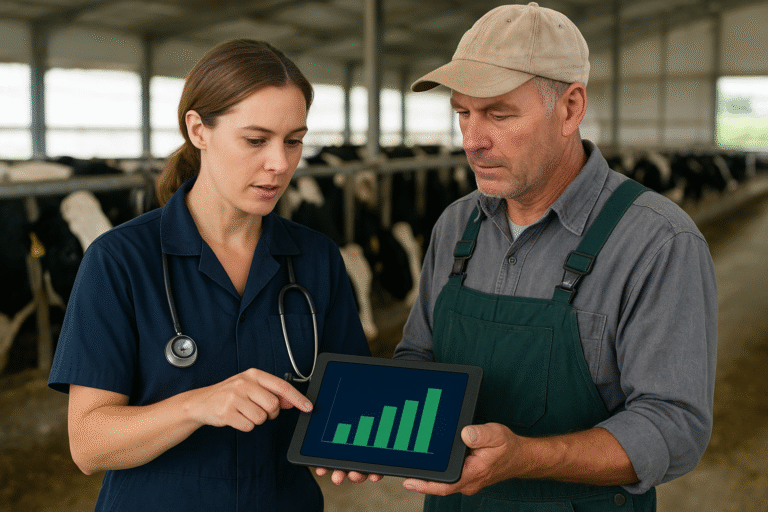
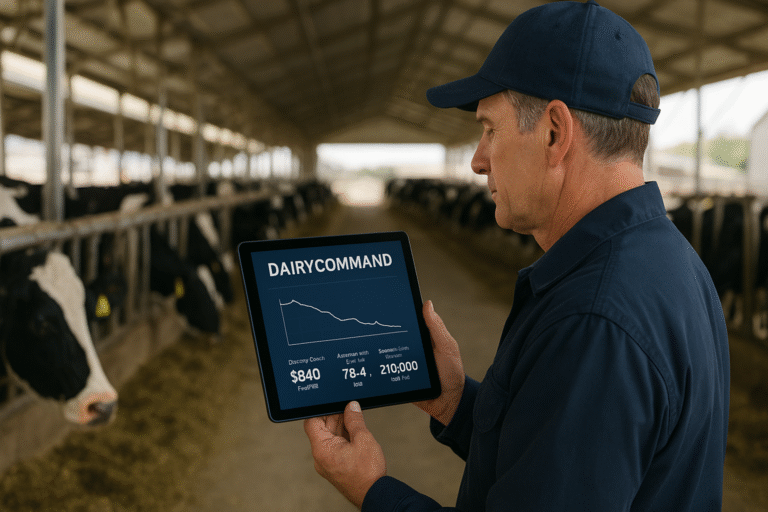
Have visual outputs ready to show during the consultation, either on a tablet or as printed handouts. Farmers respond far better to visual data presentations than verbal statistics. A simple bar chart showing milk losses by disease becomes a powerful anchor for discussion, making abstract concepts like “disease burden” immediately tangible and relatable.
During the Consultation: Structuring Data-Driven Conversations
The consultation itself is where you translate prepared insights into collaborative decision-making. Structure matters here. The goal is not to present a data report, but to facilitate a conversation where disease burden insights complement both your clinical expertise and the farmer’s operational knowledge.
Open the conversation by establishing context. Rather than immediately diving into numbers, frame the discussion: “I reviewed your herd’s disease data from the last six months before today’s visit.” This signals that you’ve done preparatory work and that the consultation will be evidence-based rather than purely observational.
Lead with the big picture before drilling into specifics. In a 400-cow herd averaging 35 liters per cow daily, you might begin: “Overall, disease-related milk losses were approximately 70,000 liters over the six-month period. That represents roughly 10 days of total herd production.” This contextualization helps farmers understand the magnitude without getting lost in technical details, and connects directly to profitability impacts they care about.
Focus your discussion on the top two to three diseases that drive the most significant impact. Show the visual output that illustrates milk losses by disease. In our example herd, you would point to the chart showing mastitis at 25,000 liters, lameness at 18,000 liters, and ketosis at 12,000 liters. The visual makes the comparison immediate and clear, and provides a foundation for discussing both short-term interventions and longer-term strategies around improving disease resilience through genetics and management.
Connect data to farm observations by inviting the farmer into the interpretation process. Ask: “Does this align with what you’ve been seeing in the barn?” This question acknowledges that data insights must be validated against operational reality. Perhaps the farmer mentions that ketosis cases seemed more severe this spring, or that they’ve noticed mobility issues affecting certain cow families. These observations add context that enriches the data-driven insights and can inform discussions about genetic selection and disease resilience.
Discuss both prevalence and milk loss patterns together, as farmers care about both metrics for different reasons. Prevalence informs breeding decisions and genetic selection for disease resistance, while milk losses connect directly to profitability. If your mastitis data shows higher case numbers but lower milk losses compared to the previous cycle, this might indicate earlier identification and treatment preventing extended production impacts. Explaining this relationship helps farmers understand how improved protocols can affect both health metrics and economic outcomes.
Move the conversation toward actionable next steps based on the insights you’ve presented. For a herd showing increased ketosis burden, you might suggest: “Based on this ketosis trend, we should review transition cow nutrition and consider implementing more frequent fresh cow monitoring. This could improve metabolic health and reduce losses. Let’s target a 30% reduction in ketosis-related milk losses for our next six-month review.” This sets a measurable goal and establishes accountability for both parties.
The key throughout this process is collaboration. You provide the data insights and clinical interpretation. The farmer provides operational context, resource constraints, and practical feasibility assessment, along with their goals around herd genetics, disease resilience, and sustainable profitability. Together, you develop strategies that are both evidence-based and implementable. This partnership approach builds trust and positions you as an advisor supporting their overall herd health and management objectives.
The Six-Month Follow-Up Cycle: Demonstrating Intervention Value
The power of disease burden insights becomes most evident during follow-up consultations. The six-month assessment cycle, previously discussed in detail regarding its scientific rationale for intervention monitoring, creates natural touchpoints for demonstrating the value of veterinary recommendations.
Six months provides sufficient time for management interventions to impact herd health metrics while maintaining enough frequency to prevent problems from compounding undetected. Global research has shown that disease economics can shift substantially over this timeframe when effective protocols are implemented (Rasmussen et al., 2024).
Structure follow-up consultations around before-and-after comparisons. Reference the previous cycle’s findings explicitly: “Six months ago, we identified ketosis as a priority concern with 12,000 liters of milk losses. We implemented enhanced transition cow monitoring and adjusted the close-up ration.” Then present the current cycle results: “This period, ketosis-related milk losses decreased to 7,000 liters—a 42% reduction that also suggests improved metabolic health in your fresh cows.”
Quantify the return on intervention in terms farmers understand. If milk losses decreased by 5,000 liters over six months, calculate the approximate value: “That 5,000-liter reduction represents roughly $3,000 in milk value saved, more than covering the costs of enhanced monitoring and ration adjustments. This also suggests your cows are entering lactation with better metabolic health.” This concrete return validates both your recommendation and the farmer’s implementation effort, while connecting to their goals around disease resilience and herd health.
When results don’t show expected improvement, frame this as collaborative problem-solving. Perhaps lameness burden increased despite implementing new footbath protocols. Discuss potential explanations: “The footbath protocol is sound, but I noticed during today’s walkthrough that freestall bedding depth has decreased. Let’s adjust bedding management alongside the footbath work and reassess in six months. We might also consider mobility scores in breeding decisions to improve genetic resistance over time.” This approach maintains trust while adapting strategies based on evidence.
Build consultation continuity by treating each six-month review as part of an ongoing advisory relationship rather than isolated events. Reference trends across multiple cycles: “Over the past year, we’ve successfully reduced mastitis burden by 38% through improved milking procedures. Now that mastitis is better controlled, our data shows ketosis emerging as the next priority. Let’s shift our focus accordingly, which will also support your goals around improving fresh cow health and metabolic resilience.” This demonstrates that you’re tracking their herd’s progress over time and adjusting recommendations strategically.
The cumulative effect of repeated six-month cycles creates a documented history of herd health improvement directly attributable to veterinary guidance. This track record strengthens your value proposition and makes the advisory relationship increasingly valuable to farm operations focused on both immediate productivity and long-term herd sustainability.
Common Consultation Pitfalls and How to Avoid Them
Even with well-prepared disease burden insights, certain common missteps can undermine consultation effectiveness. Recognizing and avoiding these pitfalls ensures that data enhances rather than complicates client interactions.
The first pitfall is data dumping without interpretation. Presenting farmers with comprehensive analytical reports and expecting them to decode the implications wastes limited consultation time and creates confusion rather than clarity. Remember that farmers benefit most from your interpretation of what the data means for their specific operation. Always digest the information first and highlight the two to three most important findings before showing any detailed outputs. Your value comes from clinical interpretation combined with the insights provided by the analytical tool.
The second pitfall involves discussing metrics in isolation. Farmers are interested in both prevalence data (which informs breeding decisions and genetic selection for disease resistance) and milk loss figures (which connect to profitability). Present both metrics together with clear explanation of their relationship. Simply stating “you had 47 mastitis cases this cycle” provides less complete insights than “mastitis prevalence was 18% with 25,000 liters of associated milk losses, representing 36% of your total disease burden. This suggests opportunities in both treatment protocols and genetic selection for mastitis resistance.”
The third pitfall is not explaining the prevalence paradox when relevant. When improved early detection protocols increase case numbers while decreasing milk losses, farmers may need help interpreting this pattern. If they’re also focused on breeding for disease resistance, they need to understand that higher recorded prevalence due to better detection is different from genetic susceptibility. Always present both metrics together and explain their relationship. Research on clinical intervention timelines has demonstrated that early detection often increases recorded prevalence while simultaneously reducing production impacts (Rollin et al., 2015).
The fourth pitfall is developing recommendations without farmer input. Data reveals opportunities, but farmers know what’s operationally feasible given their labor constraints, facility limitations, cash flow, breeding goals, and personal management philosophy. After presenting insights, always ask: “Given your operation and goals, which of these interventions makes the most sense to implement?” This collaborative approach respects farmer expertise and ensures recommendations align with their priorities around herd health, genetics, and profitability.
The fifth pitfall is failing to schedule follow-up assessment. One-time data review provides limited value compared to trend analysis across multiple cycles. Before concluding each consultation, schedule the next six-month disease burden review. This creates accountability for both parties and establishes the ongoing nature of the advisory relationship. Make it a standing appointment on both calendars rather than something to be arranged later.
Conclusion: From Data to Insights to Action
The fundamental challenge in modern dairy herd management is not data scarcity but insights translation. Farms generate enormous volumes of information daily, yet much of this data remains underutilized during the critical moments when management decisions are made. Disease burden analysis addresses this gap by condensing complexity into consultation-ready insights.
Your role as a veterinarian is to serve as the bridge between three essential domains: data, disease, and decision. The analytical tool provides the foundation by quantifying milk losses across diseases and time periods. Your clinical expertise gives these numbers meaning by connecting them to specific herd conditions, management practices, and intervention opportunities. The farmer’s operational knowledge ensures that evidence-based recommendations are practically implementable given real-world constraints and align with their goals around herd health, genetic improvement, and sustainable profitability.
Effective use of disease burden insights during consultations requires systematic preparation, structured conversation frameworks, and consistent follow-through. Run analyses before visits to identify key talking points. Present findings visually to make both prevalence patterns and economic impact immediately clear. Invite collaborative interpretation that respects farmer expertise and their priorities around disease resilience and herd genetics. Establish measurable goals and schedule six-month follow-up reviews to demonstrate intervention value over time.
Avoid common pitfalls by focusing on interpretation rather than data presentation, presenting both prevalence and milk loss metrics together with clear explanation of their relationship, acknowledging when detection improvements affect case numbers, developing recommendations collaboratively that align with farmer goals, and maintaining consultation continuity through scheduled follow-ups.
The cumulative effect builds an advisory relationship where your value extends far beyond responding to individual health problems. You become a strategic partner in herd optimization, using quantified insights to guide protocol development, validate intervention effectiveness, and document tangible returns on management investments in areas farmers care about: productivity, animal health, disease prevention, and genetic improvement.
Disease burden analysis doesn’t replace your clinical judgment—it complements and amplifies it. The tool handles computational heavy lifting, translating thousands of data points into actionable summaries. You provide the irreplaceable context: clinical interpretation, farm-specific knowledge, intervention design, and collaborative guidance that turns insights into improved herd outcomes that support both immediate profitability and long-term sustainability goals.
Ready to enhance your veterinary consultations with disease burden insights? Access our veterinary practice guide for implementation resources and consultation frameworks. Learn how to integrate systematic disease burden reviews into your herd health programs and demonstrate measurable value to your dairy clients.
References
Owusu-Sekyere, E., Hansson, H., and Telezhenko, E. (2023). Dairy cow longevity: Impact of animal health and farmers’ investment decisions. Journal of Dairy Science, 106(5), 3207-3220. https://www.journalofdairyscience.org/article/S0022-0302(23)00162-5/fulltext
Puerto, M.A., Shepley, E., Cue, R.I., Warner, D., Dubuc, J., and Vasseur, E. (2021). The hidden cost of disease: I. Impact of the first incidence of mastitis on production and economic indicators of primiparous dairy cows. Journal of Dairy Science, 104(7), 7932-7943. https://www.journalofdairyscience.org/article/S0022-0302(21)00510-5/fulltext
Rasmussen, P., Barkema, H.W., Osei, P.P., Taylor, J., Shaw, A.P., Conrady, B., Chaters, G., Muñoz, V., Hall, D.C., Apenteng, O.O., Rushton, J., and Torgerson, P.R. (2024). Global losses due to dairy cattle diseases: A comorbidity-adjusted economic analysis. Journal of Dairy Science, 107(9), 6945-6970. https://www.journalofdairyscience.org/article/S0022-0302(24)00821-X/fulltext
Rollin, E., Dhuyvetter, K.C., and Overton, M.W. (2015). The cost of clinical mastitis in the first 30 days of lactation: An economic modeling tool. Preventive Veterinary Medicine, 122(3), 257-264. https://www.sciencedirect.com/science/article/pii/S0167587715300490