Increase Milk Production in Cows: Get More Milk with Fewer Animals
You’re producing 75 pounds per cow per day. Your neighbor with the same feed program and similar facilities? 80 pounds per cow. What’s the difference? It might not be what you feed or how you house your cows. It could be which cows you’re keeping.
Most dairy farmers focus on increasing milk production by improving nutrition, upgrading facilities, or refining protocols. These matter, but they miss something bigger. The fastest path to higher production often means working with fewer, better-performing cows. Research shows farms can boost total milk output while actually reducing herd size through strategic cow selection (Han et al., 2024).
This isn’t about pushing individual cows harder. It’s about identifying which animals consistently deliver strong performance and which ones quietly drain profitability. When you optimize herd composition based on lifetime data rather than recent snapshots, you can achieve 5% more milk with 10% fewer cows. That means lower feed costs, reduced labor, less facility strain, and higher profit per cow.
Why Traditional Approaches to Increase Milk Production Fall Short
Walk into any farm supply store and you’ll find dozens of products promising to boost milk yield. Better feed additives. Upgraded milking systems. New supplements. These investments can help, but they treat every cow the same. The problem? Not every cow responds equally, and some animals will underperform no matter what you do.
Traditional production metrics focus on current lactation snapshots. You see today’s test day results. You track this month’s average. But these numbers hide critical patterns. A cow producing 75 pounds today might be declining steadily from 85 pounds at peak. Another cow at 75 pounds might be climbing from 65 pounds early lactation. Snapshot data can’t tell you which cow is which.
This matters because your lowest producers cost nearly as much to maintain as your best performers. Feed, labor, facility space, veterinary care, these expenses don’t scale with production. A cow giving 60 pounds per day costs almost as much as one giving 85 pounds. When you focus only on raising the average without considering individual cow performance over time, you’re investing in animals that may never deliver returns.
The Hidden Cost of Keeping Chronic Underperformers
Every herd has them. Cows that look fine on paper. Decent genetics. No obvious health problems. Acceptable production in any single test. But when you track their complete performance across multiple lactations, a pattern emerges. They consistently produce below herd average. Not by much, maybe 5 to 10 pounds per day. But this adds up.
Consider a cow producing 5 pounds less than herd average daily. Over a 305-day lactation, that’s 1,525 pounds of lost milk. At $0.40 per pound, you’re leaving $610 on the table per lactation. If she stays in your herd for three lactations at this performance level, that’s $1,830 in unrealized revenue from just one animal.
Many farmers might discover 10 to 15 cows following this pattern in a 100-cow herd. Combined, these animals could represent $6,000 to $9,000 in annual lost production. You’re feeding them. Housing them. Treating them when they get sick. But they’re quietly costing you money every day.
Research on dairy cow longevity shows that farms maintaining animals with consistently below-average lifetime production significantly impact overall economic performance (Vredenberg et al., 2021). The opportunity cost isn’t just the milk they don’t produce. It’s also the space they occupy that could go to higher-performing animals.
How Lifetime Trajectory Analysis Reveals True Performers
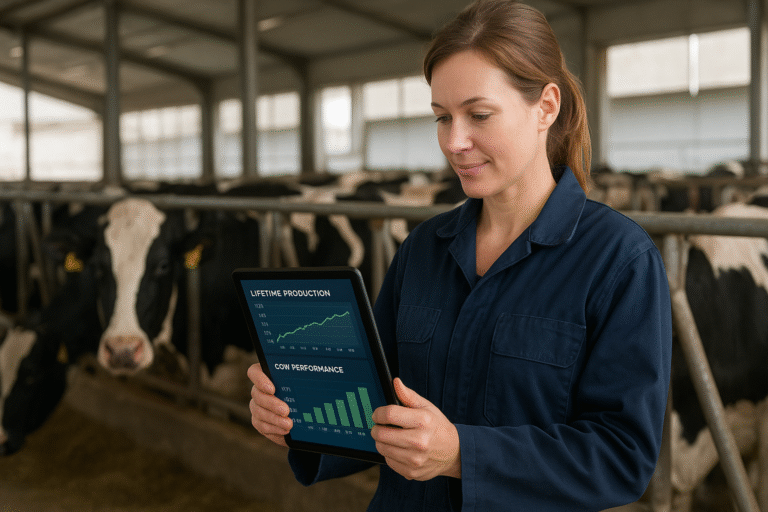
Single test day results tell you what happened yesterday. Lifetime trajectory analysis shows you what’s been happening across a cow’s entire productive life. This distinction changes everything about how you evaluate your herd.
When you analyze complete lactation curves across multiple cycles, patterns emerge. Some cows peak higher and maintain production better than others with similar genetics. Some recover well from health challenges. Others never fully rebound. Some breed back efficiently cycle after cycle. Others consistently take longer to conceive, extending days in milk and reducing lifetime productivity.
A cow might produce 80 pounds at peak in her second lactation. Sounds good. But trajectory analysis might reveal she peaked at 90 pounds in first lactation and 85 pounds in third. She’s declining. Another cow peaks at 75 pounds every lactation like clockwork. Lower peaks, but consistent performance. Over five lactations, the consistent performer often delivers more total milk.
Research on predicting dairy cattle lifetime production demonstrates that analyzing complete performance trajectories identifies animals with superior long-term value that snapshot evaluations miss (Perneel et al., 2024). The cows that look best on any single test day aren’t always the ones contributing most to your bottom line over time.
Strategic Herd Composition: The Path to More Milk with Fewer Cows
Here’s what sounds counterintuitive but works. Reducing herd size can increase total milk production. The key is removing the right animals while retaining and breeding from your consistent top performers.
Imagine running a 100-cow herd averaging 75 pounds per cow per day. Total production: 7,500 pounds daily. Now imagine identifying and culling the bottom 10 cows, chronic underperformers averaging 60 pounds per day. You’re down to 90 cows, but you’ve removed 600 pounds of the lowest production.
Your remaining 90 cows were producing 6,900 pounds combined (7,500 minus the 600 from culled animals). That’s 76.7 pounds per cow per day average. But here’s where it gets interesting. With improved herd composition, you can focus resources on your better performers. Better breeding decisions. More strategic health interventions. Improved reproductive management for cows that actually deliver returns.
Research on extending dairy cow longevity through adjusted reproduction management shows that strategic breeding decisions focused on superior performers can maintain or increase production while reducing herd size (Han et al., 2024). Farms optimizing herd composition this way often achieve 78 to 80 pounds per cow average with their refined 90-cow herd. That’s 7,020 to 7,200 pounds daily total, matching or exceeding original production with 10% fewer animals.
Lower feed costs. Reduced labor hours. Less facility wear. Fewer health interventions. And you’re producing the same or more milk. This approach doesn’t require expensive capital investments or dramatic management changes. It requires identifying which cows to keep and which to move out of your herd.
Data-Driven Breeding and Culling Decisions
Making these strategic composition changes requires moving beyond gut feelings and recent performance. You need complete lifetime data showing which animals consistently deliver and which ones don’t.
Traditional culling decisions often focus on obvious problems. Severe lameness. Repeated mastitis. Chronic reproduction failures. These cows get culled. But what about the animals that aren’t dramatically bad, just consistently mediocre? These are the hardest decisions and often the most profitable ones to make correctly.
Data-driven breeding decisions work similarly. Most farmers breed their younger cows with better genetics and higher recent production. But young cows with poor lifetime trajectories might not be your best breeding candidates, even if they look good today. Older cows with consistent performance across five or six lactations might be better genetic investments, even if their current snapshot looks less impressive.
A robust approach analyzes multiple factors simultaneously. Health history across complete lifetimes. Reproductive efficiency over multiple cycles. Production trajectories spanning all lactations. Genetic indices. Days to conception patterns. When you weight these factors appropriately and compare each cow against herd-specific averages, you identify true top performers and chronic underperformers.
This level of analysis reveals opportunities farmers often miss. A cow might have impressive genetic indexes but consistently underperform your herd average across every lactation. Another cow might look average on paper but consistently exceed herd benchmarks year after year. Which one should you breed? Which should you cull? The answer isn’t obvious from snapshot data, but it becomes clear with complete lifetime analysis.
Implementing Herd Optimization on Your Farm
You don’t need to overhaul your entire operation overnight. Start by gathering complete production, health, and reproduction records for every cow. Most farms using DC305 or similar herd management software already have this data. The challenge is analyzing it to reveal meaningful patterns.
Begin with your lowest-producing 10 to 15 cows based on current data. Pull their complete lactation histories. Look for patterns. Are they consistently below herd average across multiple lactations? Do they take longer to breed back? Do they have recurring health issues that reduce long-term productivity? These animals become your first culling candidates.
Next, identify your top 20% performers using the same lifetime criteria. These cows become breeding priorities. Use sexed semen on them. Extend their productive lives through strategic reproduction management. Invest in keeping them healthy because they’re delivering returns.
The middle 60% of your herd requires more nuanced decisions. Some are rising performers worth keeping. Others are declining and should exit within one or two lactations. Lifetime trajectory data helps you distinguish between them.
Track results over time. Many farms working through this process see measurable improvements within 12 to 18 months. Herd averages climb. Total production holds steady or increases despite fewer animals. Profitability improves as costs decline while revenue maintains or grows.
Beyond Nutrition and Facilities: The Management Advantage
Most advice on increasing milk production focuses on things you buy. Better feed. New technology. Upgraded facilities. These investments matter, but they benefit all cows equally. Your best cow gets the same feed as your worst cow. Your top producer uses the same stall as your chronic underperformer.
Management decisions about which cows to keep, breed, and cull create competitive advantage because they’re harder to copy. Your neighbor can buy the same feed you use. They can’t replicate your herd composition decisions unless they’re analyzing the same lifetime data.
This is why progressive farms increasingly focus on cow selection as their primary production lever. Feed and facilities establish your baseline. Genetics set your ceiling. But daily management decisions about individual animals determine where you actually perform within that range.
Farms that excel at this don’t just track more data. They analyze it differently. They look at complete lifetimes, not current lactations. They compare individual cows to herd-specific averages, not generic benchmarks. They make breeding and culling decisions based on patterns, not snapshots.
The result? They produce more milk with fewer cows, lower costs, and higher profits. Not because they found some secret supplement or magic feed additive. Because they identified which animals truly contribute to their bottom line and made strategic decisions accordingly.
Getting Started with Data-Driven Herd Optimization
You already have the foundation. If you’re using herd management software and tracking production, health, and reproduction data, you have what you need. The challenge is analyzing this information to reveal actionable patterns.
Start by pulling complete lactation histories for every cow in your herd. Calculate lifetime production averages. Identify animals consistently above or below herd benchmarks. Look at reproductive efficiency across multiple cycles. Review health events spanning complete productive lives.
This analysis takes time when done manually, but it reveals opportunities. You might discover 12 to 15 cows that look acceptable on recent tests but have underperformed your herd average across every lactation. You might identify 8 to 10 older cows with consistent superior performance worth breeding despite their age.
These insights drive better decisions. Cull chronic underperformers even if they’re not dramatically bad today. Breed consistent top performers even if they’re older or look average in recent snapshots. Focus your management attention on animals that actually deliver returns.
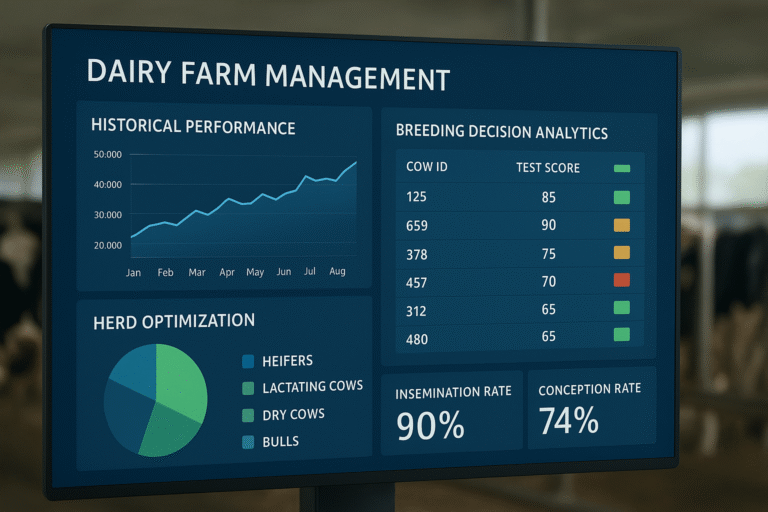
DairyCommand’s Herd Optimization Simulator analyzes five years of historical data to reveal exactly where your breeding and culling decisions could improve. The simulator shows what your herd could have produced with optimized composition, identifies specific decision patterns to adjust, and projects how changes would affect production and profitability. Many farms using this approach discover they can maintain or increase total milk output while reducing herd size 8 to 10%, significantly improving profitability through lower costs.
The Path Forward: Sustainable Production Growth
Increasing milk production doesn’t always mean pushing individual cows harder or buying expensive new equipment. Sometimes it means working with fewer, better-performing animals. When you optimize herd composition based on lifetime performance data, you can achieve higher total production with lower costs.
This approach takes time. Herd optimization follows biological timelines, not calendar timelines. Significant results emerge over 18 to 36 months as you cull chronic underperformers and breed from consistent top performers. But the improvements compound. Each year, your herd composition gets stronger. Averages climb. Efficiency improves. Profitability grows.
The farms that win this game don’t necessarily have the best genetics or the newest facilities. They make better decisions about which cows to keep and breed. They analyze complete lifetimes, not current snapshots. They focus resources on animals that actually deliver returns.
You can start today. Pull your herd data. Analyze lifetime patterns. Identify your true top performers and chronic underperformers. Make strategic breeding and culling decisions based on complete performance histories. Track results over time.
More milk with fewer cows isn’t just possible. It’s the competitive advantage progressive farms use to stay profitable in challenging markets. From our family to yours, we know every cow represents an investment and every decision matters. The question isn’t whether to increase milk production. It’s how to do it most profitably, and the answer often lies in the cows you’re keeping, not the feed you’re buying.
References
Han, R., Kok, A., Mourits, M., and Hogeveen, H. (2024). Effects of extending dairy cow longevity by adjusted reproduction management decisions on partial net return and greenhouse gas emissions: A dynamic stochastic herd simulation study. Journal of Dairy Science, 107(9), 6902-6912. https://www.sciencedirect.com/science/article/pii/S0022030224007689
Perneel, M., De Smet, S., and Verwaeren, J. (2024). Data-driven prediction of dairy cattle lifetime production and its use as a guideline to select surplus youngstock. Journal of Dairy Science, 107(11), 9390-9403. https://www.journalofdairyscience.org/article/S0022-0302(24)00069-9/fulltext
Vredenberg, I., Han, R., Mourits, M., Hogeveen, H., and Steeneveld, W. (2021). An empirical analysis on the longevity of dairy cows in relation to economic herd performance. Frontiers in Veterinary Science, 8, 646672. https://www.frontiersin.org/journals/veterinary-science/articles/10.3389/fvets.2021.646672/full
Related Resources:
About DairyCommand
From our family to yours: we’re dairy people who understand that every cow represents an investment and every decision matters. DairyCommand combines veterinary science, data analytics, and practical farm experience to help you build a more profitable, sustainable operation. Our Herd Optimization Simulator analyzes your historical data to show exactly how strategic breeding and culling decisions can increase production while reducing costs. Learn more about our herd optimization tools at signal2action.com